A Notebook That Tells a Story
A report notebook leads its reader from a title and the question to the short answer first, then the evidence, how it was done and what the data can't show, written in Markdown cells with headings, lists, bold and tables, and kept apart from the notebook you explored in.
Journeyman · Python · Updated
After this lesson you can
- Arrange a report notebook in order, a title, the question, the short answer, the evidence, how it was done and what the data can't show
- Write Markdown cells with headings, lists, bold text and a table
Key takeaways
- A notebook someone else reads follows an order, a title, the question, the short answer, the evidence, how it was done, and what the data can't show.
- The short answer comes first, so a busy reader gets it at once and reads on only for the proof.
- Each point of the short answer gets its evidence, a table or a chart from a code cell, with a sentence before it that says what to look at.
- In a Markdown cell,
- Explore in one notebook and tell the story in another, so the reader sees only the steps that lead to the answer.
You've found the answer. Now someone else has to follow it: a manager deciding next year's budget, a professor grading your project, a client who paid for the analysis. They didn't watch you work, and most of them won't read your code. This lesson turns a notebook into a report they can follow from the top.
The example is Pine Valley Community Center's classes, classes.csv: one row for each class session it ran from November 2025 to October 2026, 588 sessions in all. Its columns are class_id, class_name, category (fitness, arts, kids or technology), month, capacity (the seats), signed_up, attended and fee. Denise, the center's director, is planning next year's schedule. The data is our own made-up data.
The notebook only you can read
An afternoon of exploring leaves a notebook like this one: classes.head(), classes.shape, three tries at a groupby, a cell that stopped with an error, a chart you didn't keep, and the answer Denise needs somewhere around cell 23. You know where to look. Denise opens it, sees code, scrolls, and closes it.
The quick fixes don't work either. Comments in the code help a programmer, not a director. A screenshot of cell 23 shows 86.5 with no hint of what it measures or which months it covers. An email with the numbers can't show where they came from, so nobody can check them.
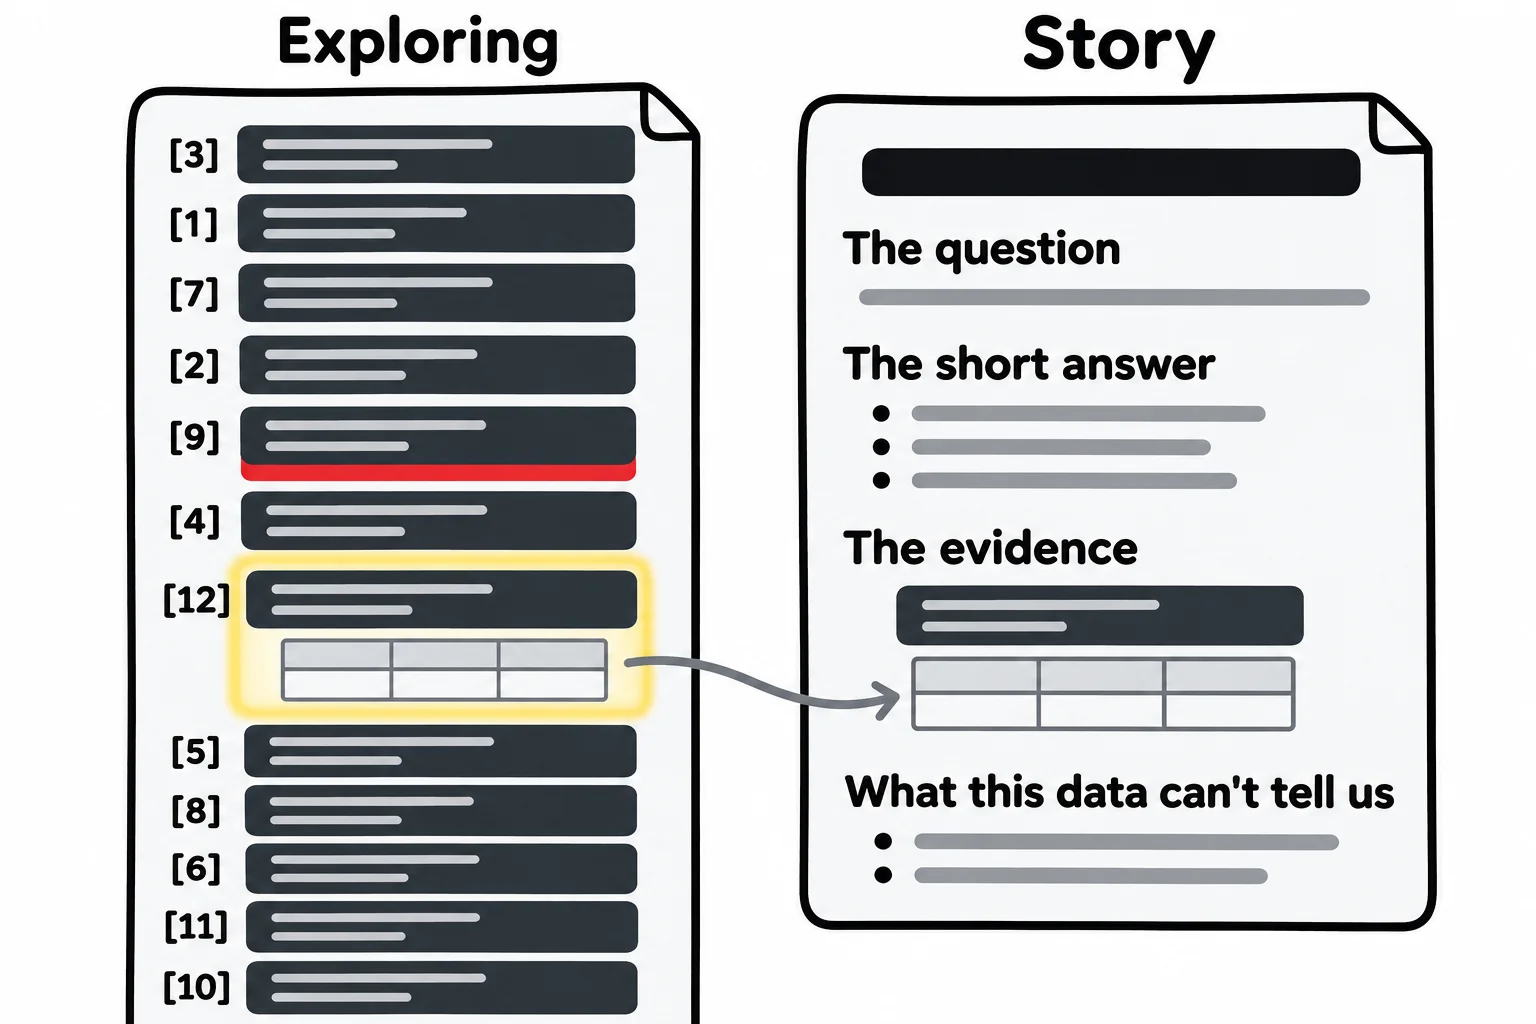
The shape of a story
A reader's questions come in an order: what was asked, what's the answer, how do you know, and can I trust it. A report notebook answers them in that order, each under its own heading:
- A title that says what the report is about.
- The question, in a sentence.
- The short answer: the findings, with their numbers, in a few lines.
- The evidence: a table or a chart for each point, from a code cell.
- How it was done: the data, and the steps that matter, such as rows left out.
- What the data can't show: the limits a reader should know before acting.
The short answer comes first, before any proof. Newspapers work this way, and at work it's called "bottom line up front": Denise may read only the first screen, so it has to hold the answer. In a business or statistics class you may see this part called an executive summary.
Under the evidence heading, a sentence says what to look at, then a code cell shows it:
import pandas as pd

classes = pd.read_csv("classes.csv")
seats = classes.groupby("category")[["signed_up", "capacity"]].sum()
seats["fill_rate"] = (seats["signed_up"] / seats["capacity"] * 100).round(1)
seats.sort_values("fill_rate", ascending=False)
            signed_up  capacity  fill_rate
category
technology        168       180       93.3
kids             1806      2088       86.5
fitness          4051      5400       75.0
arts             1276      1824       70.0
The fill_rate is the share of seats people signed up for, as a percent. Each number in the short answer points back to a cell like this, so anyone can check it.
Markdown cells: headings, lists, bold and a table
The words of a report go in Markdown cells: plain text where a few marks set the formatting. Here is the short answer's cell, as you type it:
## The short answer

- **Kids classes fill best:** 86.5% of their seats were taken.
- **January was the busiest month,** with more people at classes than any other month.
- **About 1 in 9 people who signed up didn't come** (11.6%).
#(read "hash") at the start of a line makes the title. Use one, at the very top.##makes a section heading, one size smaller. Each part of the story gets one.-(a dash and a space) starts a list item;1.starts a numbered one.**two stars**on each side make the words bold, so the finding stands out from its details.
A small table uses pipes, | (read "pipe"), between the cells, and a line of dashes under the header row:
| Category | Seats filled |
|---|---|
| kids | 86.5% |
| fitness | 75.0% |
Run the cell (Shift+Enter) and it shows as formatted text, with the table drawn as a grid. Type a table by hand only for a few numbers; numbers from the data belong in code cells, so they update when the data does.
Explore in one notebook, tell the story in another
Exploring is real work, and its notebook is worth keeping: the dead ends show what you ruled out. Its textbook name is exploratory data analysis, or EDA. It isn't the report, though, so keep two notebooks in the project folder. explore.ipynb holds everything you tried. story.ipynb holds only the cells that lead to the answer, in order, with the Markdown that explains them. When the exploring finds something, copy the few cells that prove it into the story, then run the story with Restart and Run All, so every number in it comes from a clean run from the top.
Check yourself
2 questions to try on the lesson page.
So what
A notebook is finished when someone else can follow it: the answer first, then the evidence for each point, then what the data can't show, each under a heading a reader can find.