What You Can Build with Python and pandas
Data analysis answers real questions with numbers, tables and charts, and this lesson shows the questions people answer with it, the tools that do the work (pandas, matplotlib and notebooks), the steps every analysis follows, and the projects you'll build in this course.
Novice · Python · Updated
After this lesson you can
- Name questions people answer with data analysis, and the tools that answer them in Python, pandas for tables, matplotlib for charts and notebooks
- Put the steps of a data analysis in order, from asking a question to loading, cleaning, answering, charting and sharing what the data shows
Key takeaways
- Data analysis answers a question with numbers, tables and charts, such as which store sold the most, whether a new bus route raised ridership, or which lab sample looks wrong.
- pandas holds a table you can program, matplotlib draws charts, and a notebook keeps your code, its results and your notes together in one file.
- Every analysis follows the same steps. Ask a question, load the data, clean it, answer the question, chart the answer, and share what it shows.
- You'll build five projects, from a first look at a coffee chain's year to a report that rebuilds itself, then an analysis of your own as the final capstone.
Bean Street Coffee has three stores, Downtown, Campus and Harbor, and its owner, Rosa, has a spreadsheet of last year's orders: about 25,000 rows, one for every coffee sold. She wants to know which store sold the most in March and whether the new cold brew was worth adding. Scrolling 25,000 rows won't tell her. A few lines of Python will, in seconds, and again next month when new orders arrive.
That's data analysis: answering a question with numbers, tables and charts, in a class project, a lab report or a job. This course teaches it, from the first file you open to a report someone else can use.
Questions people answer with data
| The question | Who asks it | What answers it |
|---|---|---|
| Which store sold the most last month? | A coffee shop's owner, every Monday | A table of sales, grouped by store and added up |
| Did the new bus route raise ridership? | A city's transit office | Riders per week before and after, drawn as a line chart |
| Which lab sample looks wrong? | A student writing a lab report | The measurements sorted, with the one far from the others flagged |
| How did this month compare with last month? | A manager, on the first of every month | A report that rebuilds itself from the new month's file |
Every row starts with a file of data and a question. The work in between is what this course teaches.
The tools: pandas, matplotlib and notebooks
pandas, written in lower case, is a Python package for tables. It loads a spreadsheet, a CSV file or a JSON file into a table called a DataFrame: named columns, one row for each record, like one sheet of a spreadsheet that you control with code instead of clicks. Here are six of Rosa's orders, and her first question answered:
import pandas as pd

orders = pd.DataFrame({
    "store": ["Downtown", "Campus", "Downtown", "Harbor", "Campus", "Downtown"],
    "total": [4.45, 3.45, 3.65, 3.95, 4.75, 2.95],
})
print(orders.groupby("store")["total"].sum())
store
Campus       8.20
Downtown    11.05
Harbor       3.95
Name: total, dtype: float64
Read the last line out loud: "group the orders by store, take each group's total, and add them up". Downtown sold the most, $11.05, and the same line works on 25,000 rows.
matplotlib is the Python package most charts are drawn with, with the titles and labels you choose. And a notebook is a file that keeps your code, its results and your notes together, like a scientist's lab notebook. You'll write your analyses in notebooks in VS Code.
The steps of every analysis
An analysis isn't one clever line of code. It's six steps, in this order:
- Ask a question, written down before you start: which store sold the most in March?
- Load the data into a table.
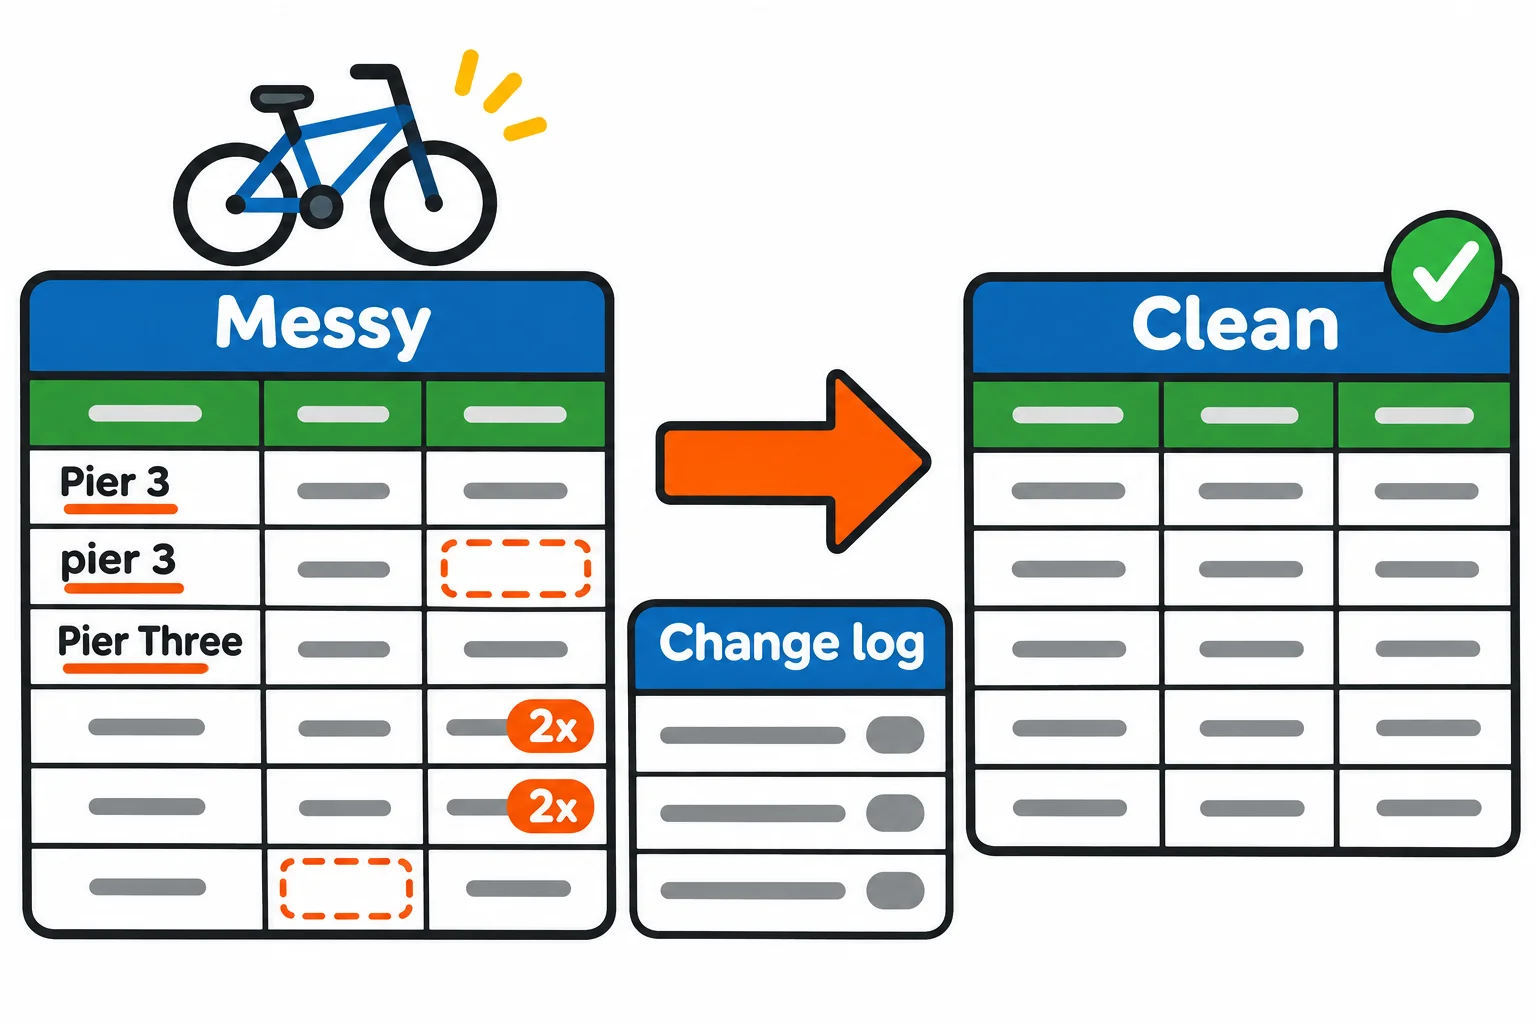
- Clean it: real data has blanks, typos and rows typed twice, and a messy table gives wrong answers.
- Answer the question: filter, sort, group and add up.
- Chart the answer, so someone who won't read a table can see it.
- Share what it shows, and what the data can't tell you.
Skipping a step is how analyses go wrong: a total that counts a row twice because nobody cleaned, or a chart nobody asked for. The course's five modules follow these steps in order.
What you'll build in this course
Each module ends with a project, a mini-capstone, with its own starter files and made-up data.
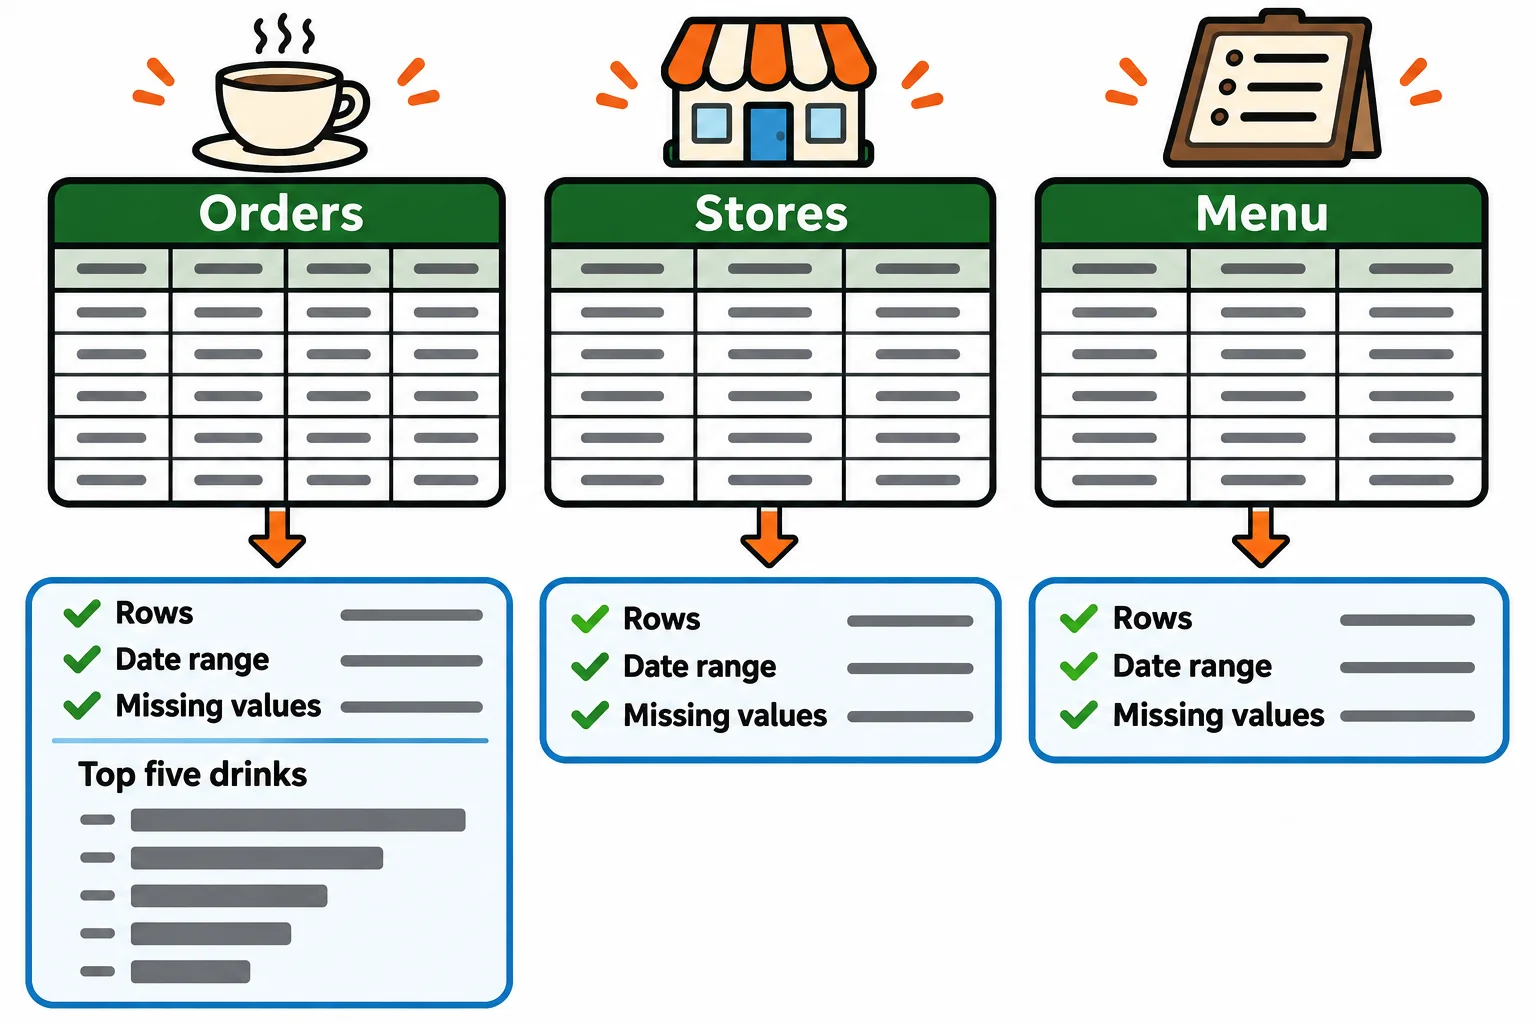
Bean Street Coffee: A First Look (Module 1). A notebook and a tested module that load a coffee chain's year and say what's in each table.
Clean a Year of Bike Rides (Module 2). A bike share's messy year turned into a clean file, with a log of every change and why it was made.
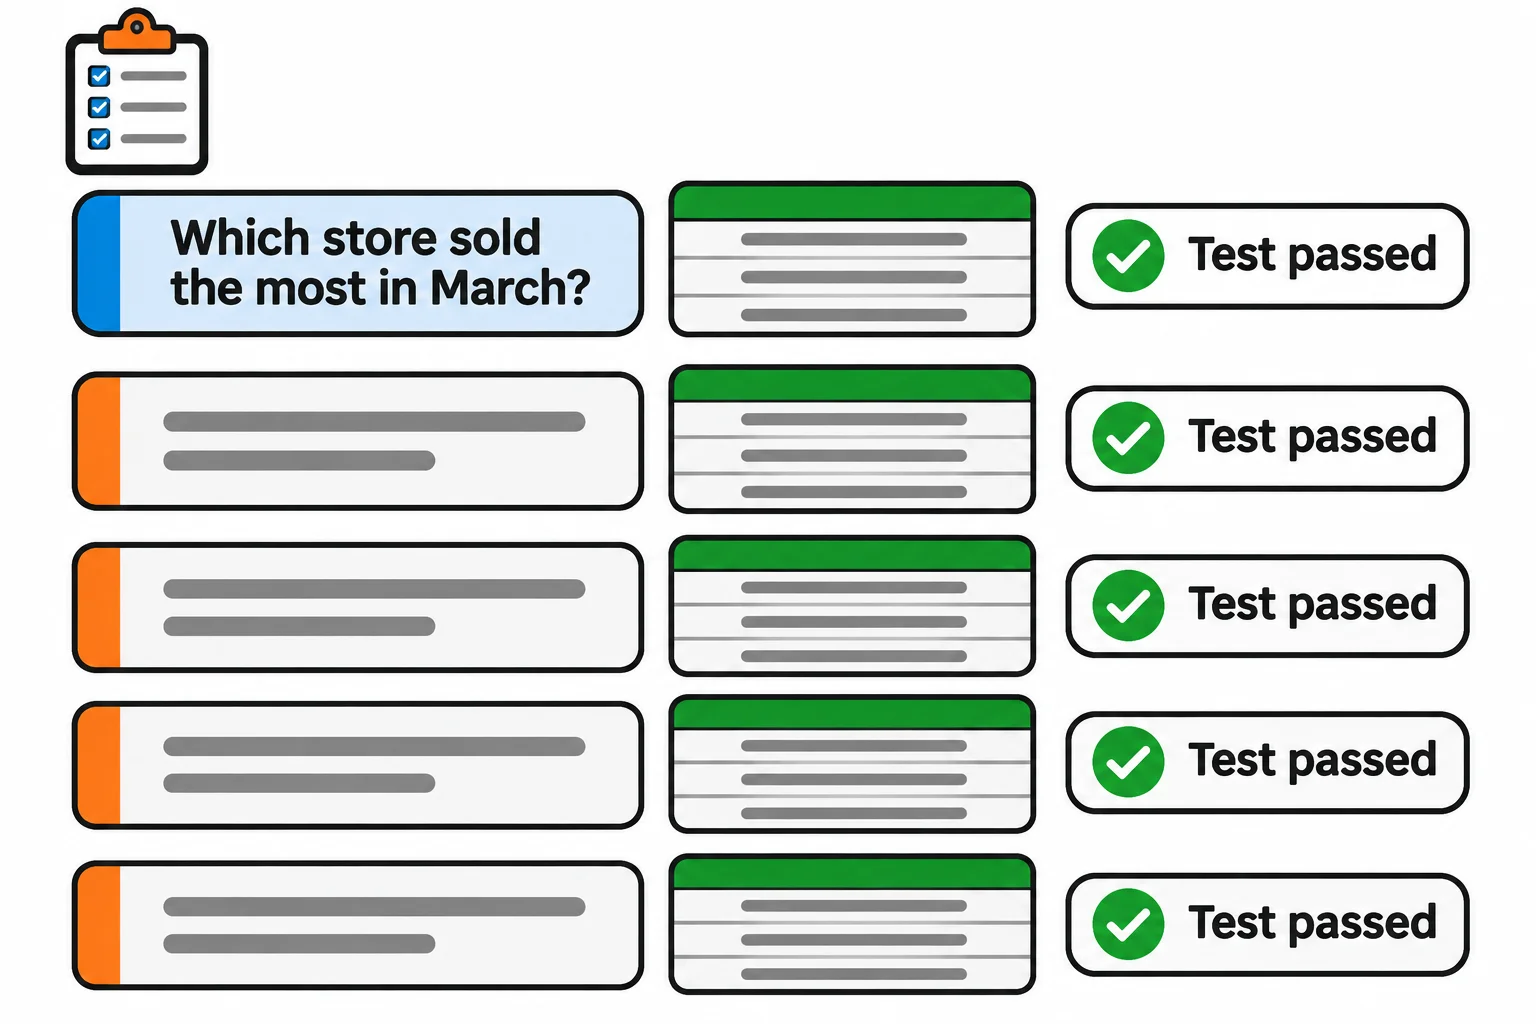
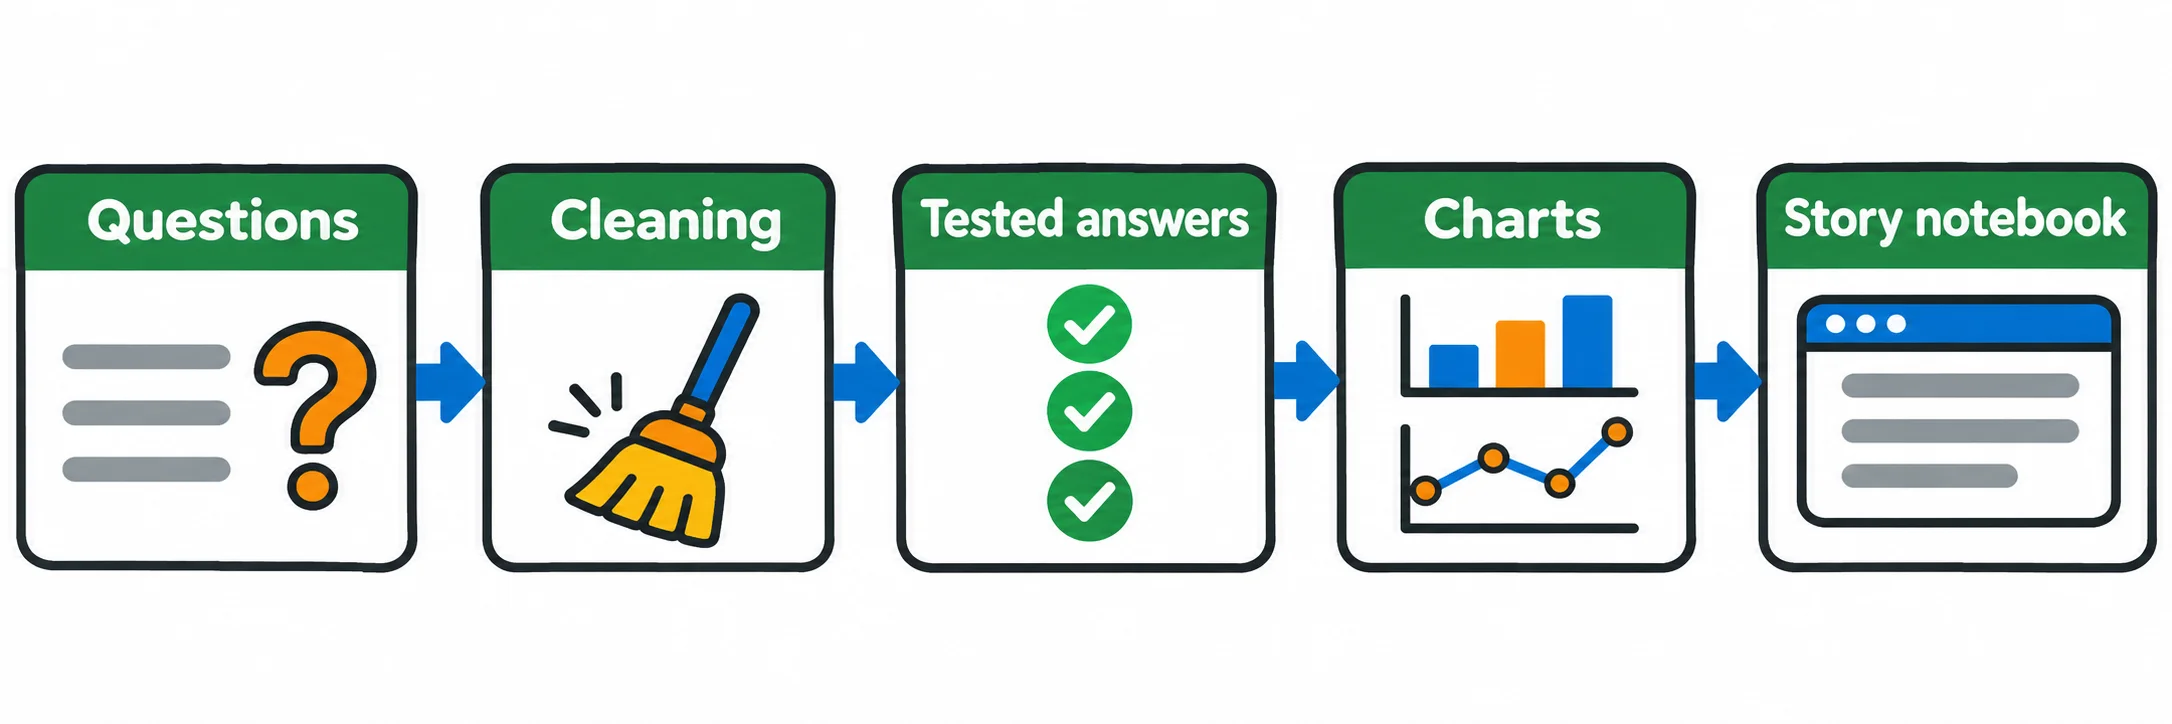
Five Questions from the Manager (Module 3). Five answers about the coffee chain's year, each from a tested function, presented in a notebook.
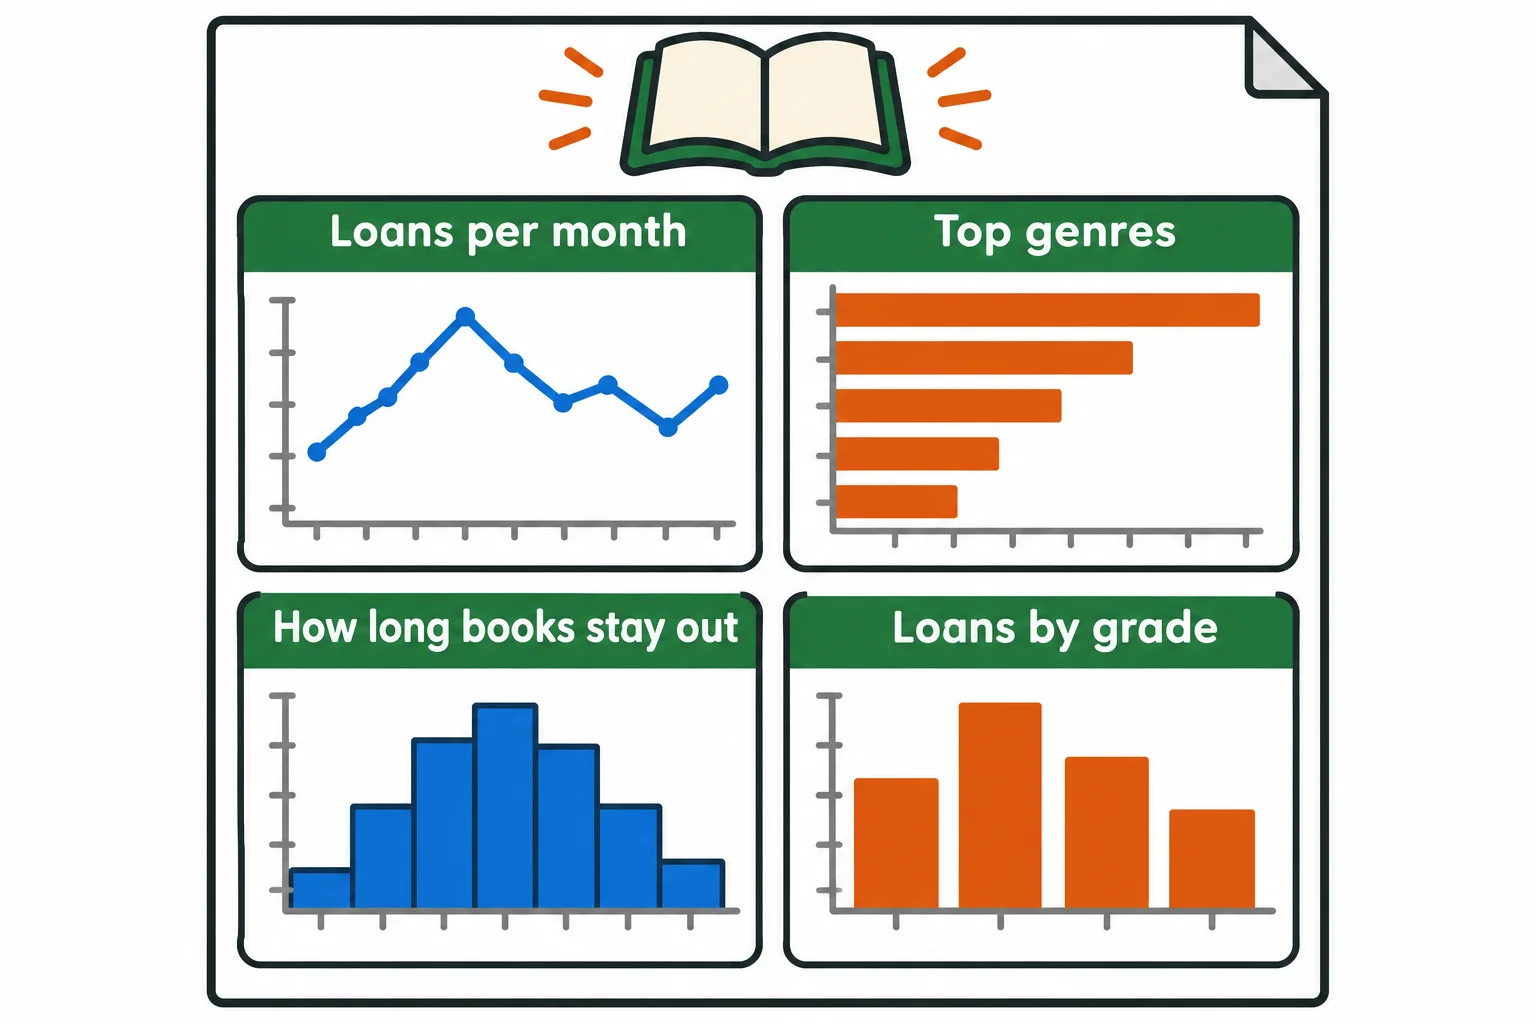
Library Loans at a Glance (Module 4). A one-page summary of a school library's year in four honest, labeled charts.
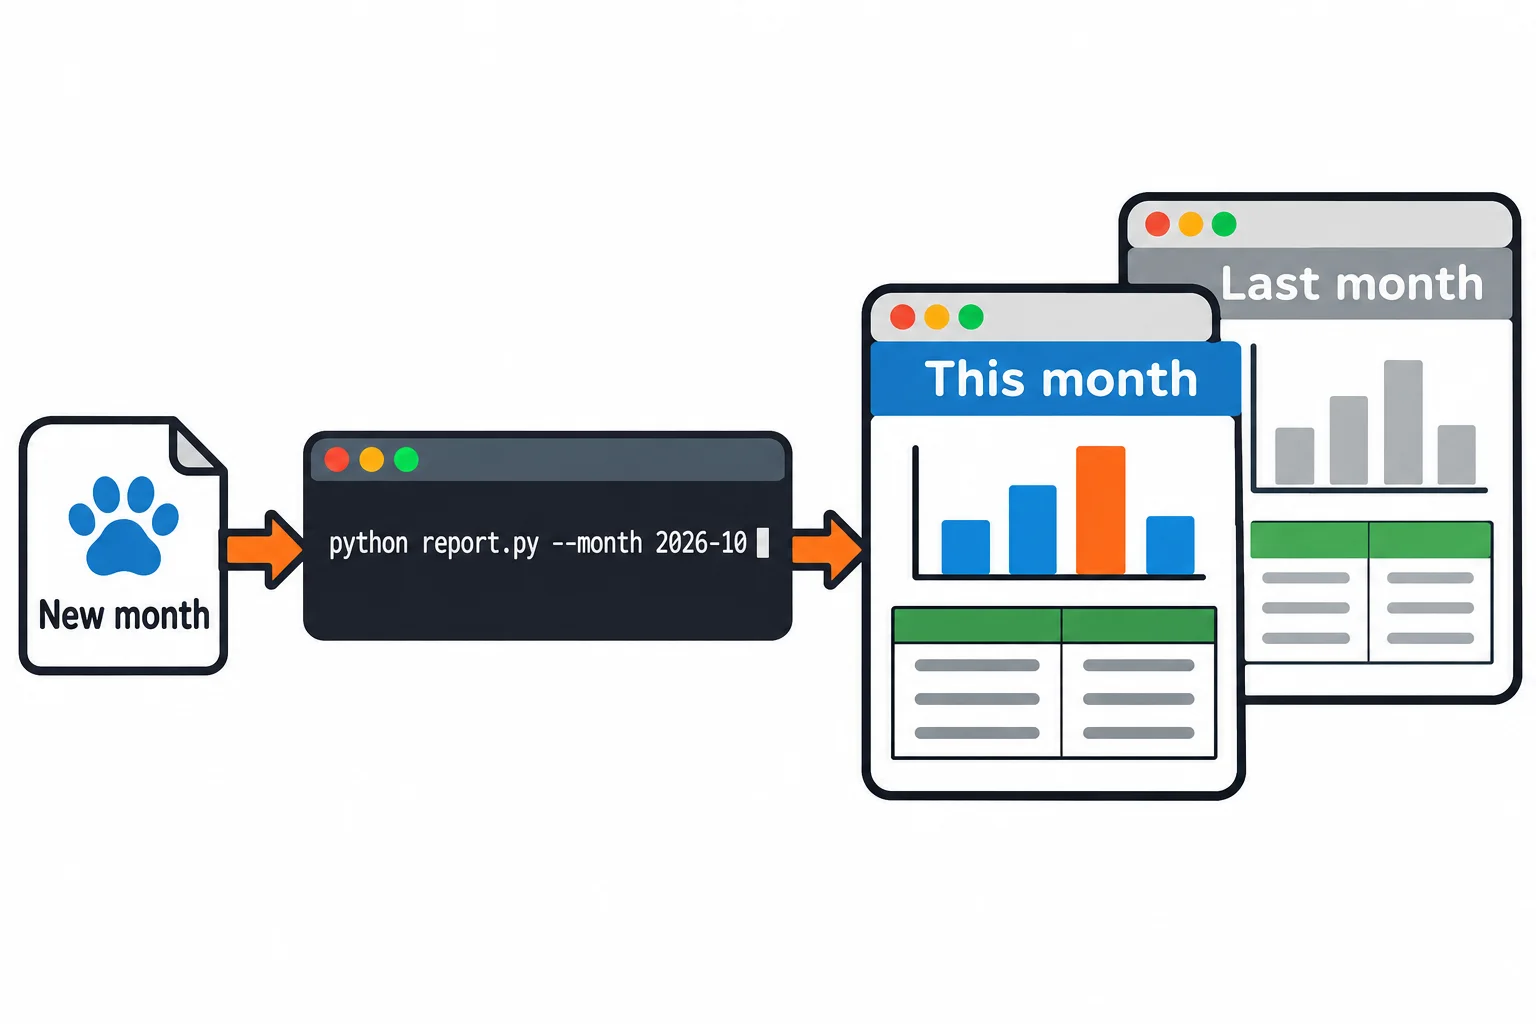
The Monthly Report That Rebuilds Itself (Module 5). A pet groomer's monthly report, as a web page that one command rebuilds when a new month's file arrives.
Your own analysis (the final capstone). A dataset you choose, your own questions, tested answers, charts and a write-up of what the data can and can't show.
Check yourself
2 questions to try on the lesson page.
So what
Every analysis is a question, a file and six steps, and with pandas, matplotlib and a notebook, the same few lines that answer six orders answer twenty-five thousand.