Visual Studio
Find your way around Visual Studio 2026, from solutions and projects to running a program and stepping through it with the debugger.
Novice · Software Development · C# · Updated
After this lesson you can
- Explain how a solution, its projects and their files fit together in Visual Studio
- Pause a running program at a breakpoint and step through it with the debugger
- Read the Call Stack window while paused: the method running now on top, and below it each method that called it
Key takeaways
- A project is one program or library, with its settings in a
.csprojfile. A solution (.slnx) holds the projects that belong together. - Each exercise in this course is a solution with two projects: your program, and the tests that check your answers.
- Ctrl+F5 builds and runs the startup project, and F5 runs it with the debugger. If the build fails, the Error List shows what's wrong and where.
- A breakpoint pauses your program so you can see every variable; F10 runs one line at a time; the Call Stack window (Ctrl+Alt+C) lists the methods that led there, newest on top.
- When a program gives a wrong answer, put a breakpoint where things should be right and step forward until a value isn't what you expect.
Visual Studio is the IDE you'll use for C# in this course. It's a large program with hundreds of menus, but you only need a few parts of it to start: where your files live, how to run your program, and how to watch it run, one line at a time.
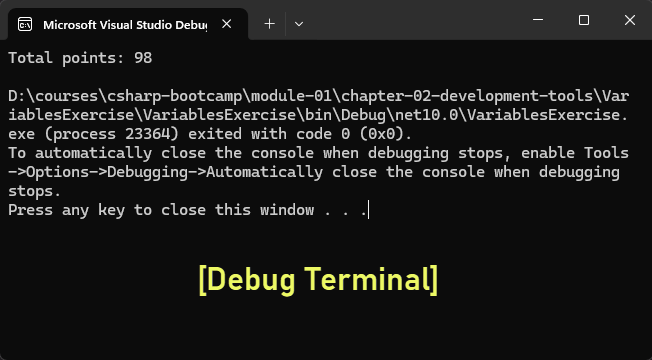
Running a console application opens a Debug Terminal.
Solutions and projects
Visual Studio organizes your work in two layers:
- A project is one program or library: its code files, its settings and the libraries it uses. Its settings live in a project file that ends in
.csproj. - A solution is a container for one or more projects that belong together, such as a web app and the tests that check it. Its file ends in
.slnx(older solutions use.sln).
When you open a solution, Visual Studio opens every project in it. In this course, each exercise is a solution with two projects: your program, and the tests that check your answers.
VariablesExercise.slnx            the solution
├── VariablesExercise/            a project: your program
│   ├── VariablesExercise.csproj
│   └── Program.cs
└── VariablesExercise.Tests/      a project: the tests
    ├── VariablesExercise.Tests.csproj
    └── AnswerTests.cs
Solution Explorer
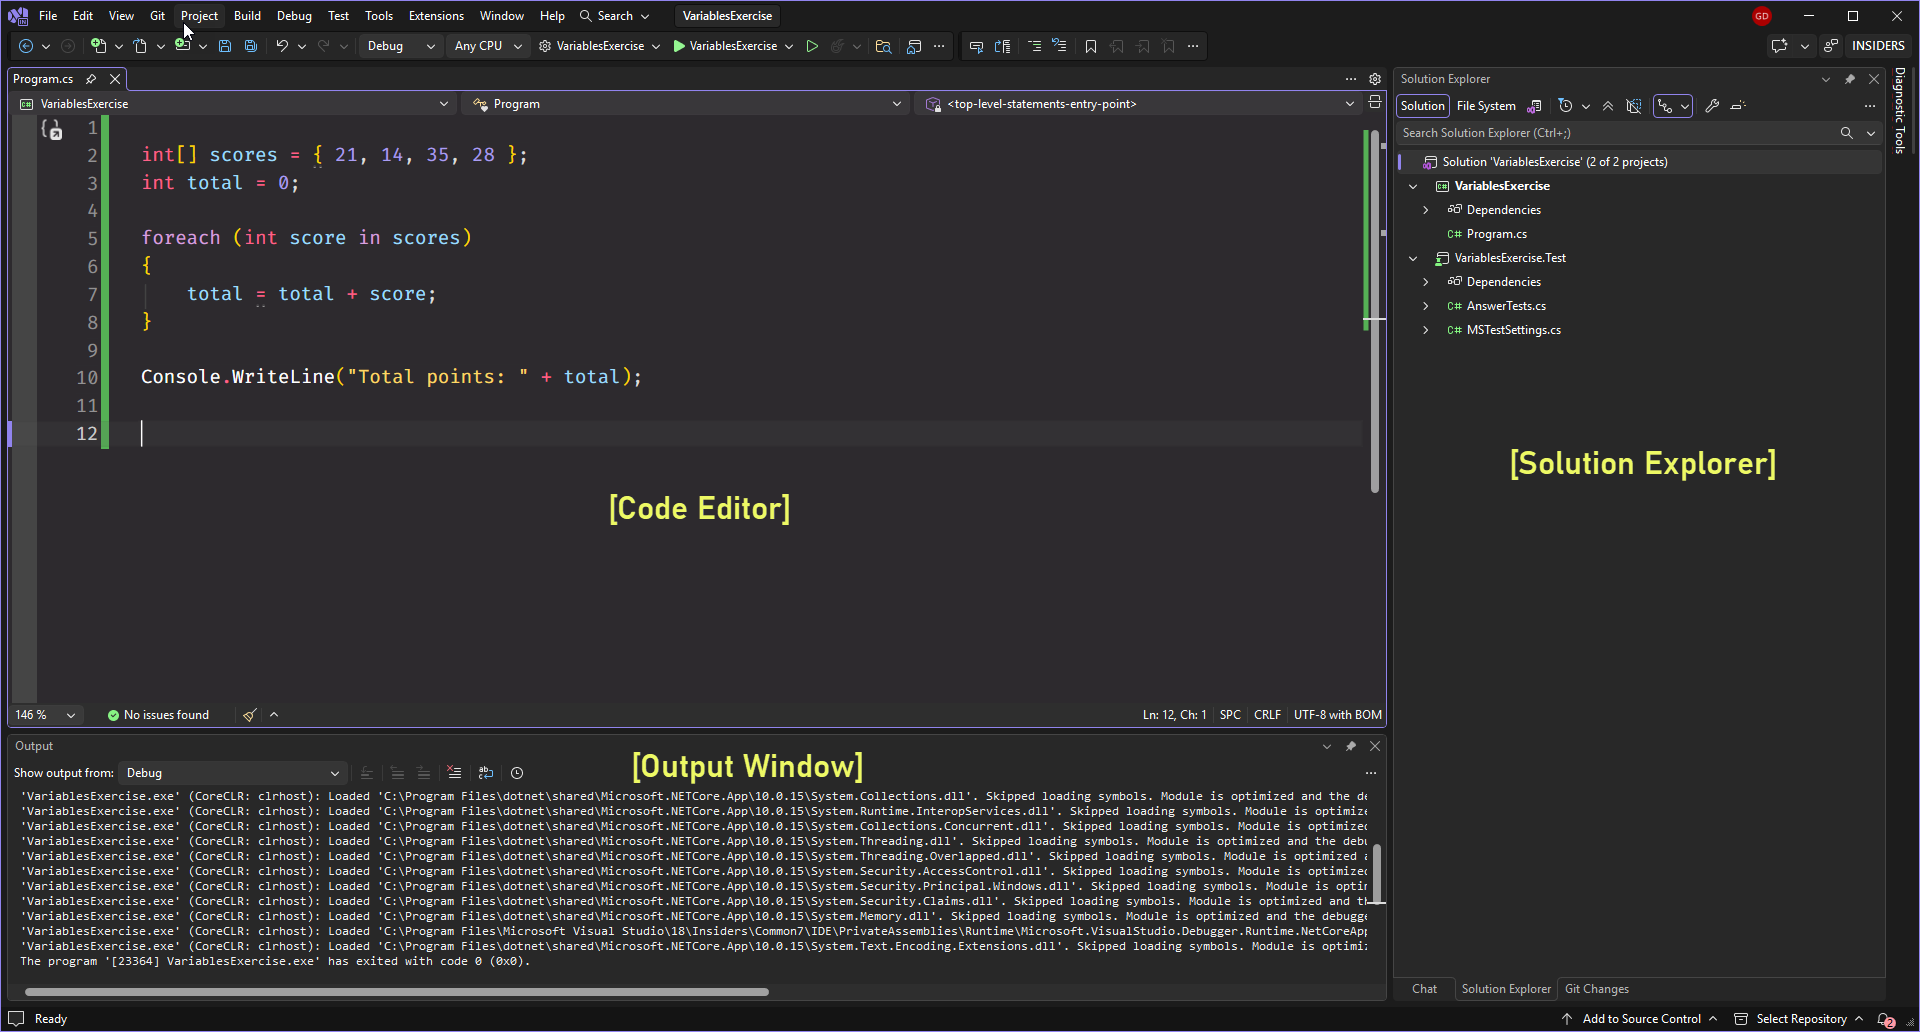
Solution Explorer, usually on the right, shows your solution, its projects and their files as a tree. Double-click a file to open it in the editor. Right-click a project to add a file to it, or to choose Set as Startup Project: the project that runs when you press the Run button.
If Solution Explorer has disappeared, open it again from View > Solution Explorer (or press Ctrl+Alt+L).
Running your program
| To | Press | Menu |
|---|---|---|
| Run without the debugger | Ctrl+F5 | Debug > Start Without Debugging |
| Run with the debugger | F5 | Debug > Start Debugging |
| Stop a running program | Shift+F5 | Debug > Stop Debugging |
Both kinds of run first build your program: Visual Studio compiles every project the startup project needs. If your code has a mistake the compiler can find, the build fails and the Error List window (View > Error List) shows what's wrong and on which line. Double-click an error to jump to it.
The debugger
A program runs thousands of lines a second, far too fast to watch. The debugger lets you pause it, look at every variable, and move forward one line at a time.
Try it now. You need a project to run, so make a quick one:
- In Visual Studio, choose File > New > Project (or Create a new project in the start window).
- Choose Console App (the one marked C#), then Next.
- Set Project name to
DebuggerTry, click Next, then Create. - In Solution Explorer, double-click
Program.csand replace its code with this program.
Don't worry about how the code works yet. int[] holds a list of scores, and foreach visits each score in turn. You will learn both in the Arrays and Loops chapter.
int[] scores = { 21, 14, 35, 28 };
int total = 0;

foreach (int score in scores)
{
    total = total + score;
}

Console.WriteLine("Total points: " + total);
Total points: 98
- Click in the gray margin to the left of the line
total = total + score;. A red dot appears: a breakpoint, a place where the program will pause. - Press F5. The program starts, and stops on that line before running it. A yellow arrow shows where it is.
- Hover over
totalandscoreto see their values. The Locals window at the bottom shows every variable at once. - Press F10 (Step Over) to run one line. Press F5 (Continue) to run until the breakpoint is reached again. Watch
totalgrow: 21, 35, 70, 98. - Click the red dot to remove the breakpoint, then press F5 to let the program finish.
| Key | Name | What it does |
|---|---|---|
| F9 | Toggle Breakpoint | Adds or removes a breakpoint on the current line |
| F10 | Step Over | Runs the current line, then pauses on the next one |
| F11 | Step Into | Like Step Over, but goes inside a method the line calls |
| F5 | Continue | Runs until the next breakpoint, or to the end |
Who called this? The Call Stack window
When a program stops on a line inside a method, the line alone doesn't tell you how the program got there. A method can be run from many places, and the mistake is often in the place that ran it, with the wrong values.
A method is a named block of steps that runs when another line writes its name, and it can hand a value back. You'll write your own in the Methods and Conditions chapter. In this program, the top line runs PrintFinalScore, and PrintFinalScore runs AddQuarters, which hands back the sum of the four quarters:
PrintFinalScore("Georgia", 12, 14, 6, 7);

void PrintFinalScore(string team, int q1, int q2, int q3, int q4)
{
    int finalScore = AddQuarters(q1, q2, q3, q4);
    Console.WriteLine(team + ": " + finalScore);
}

int AddQuarters(int q1, int q2, int q3, int q4)
{
    return q1 + q2 + q3 + q4;
}
Georgia: 39
Think of a stack of plates. Each time a method runs another, a new plate goes on top; when that method finishes, its plate comes off, and the one below carries on from where it was. The debugger's Call Stack window shows that stack:
Replace the code in
Program.cswith the program above, and put a breakpoint on the linereturn q1 + q2 + q3 + q4;.Press F5. The program pauses on that line.
While it's paused, choose Debug > Windows > Call Stack (or press Ctrl+Alt+C). The window lists one row for each method that is running, the newest on top:
- the top row is
AddQuarters, with the yellow arrow: where the program is paused now; - below it,
PrintFinalScore, the method that ranAddQuarters, waiting on the line that called it; - at the bottom, the program's top-level code, which Visual Studio names
<Main>$: it ranPrintFinalScore.
Visual Studio adds the project's name and extra characters around each method's name; look for the name you wrote, and the line number at the end of the row.
- the top row is
Double-click the
PrintFinalScorerow. The editor shows the line that calledAddQuarters,int finalScore = AddQuarters(q1, q2, q3, q4);, and the Locals window switches to that method's variables,teamamong them.Press F5 to let the program finish.
The Call Stack window only fills in while the program is paused in the debugger. When a program stops with an error deep inside a method, it's the first window to open: read it from the top down, and you follow the trail back to the code that started it.
When a program gives a wrong answer, the debugger is how you find out why: put a breakpoint where things should be right, and step forward until a value isn't what you expect.
Check yourself
2 questions to try on the lesson page.
So what
Visual Studio does three jobs for you: it keeps your projects organized in a solution, it builds and runs them with one key, and its debugger shows you what your program is really doing, line by line.