Fitting a Line
A straight line through a scatter plot of home sales turns a home's size into a price guess, the intercept plus the slope times the size, and least squares picks the best line, the one whose squared errors add up to the least, which Python's statistics.linear_regression finds for you.
Apprentice · AI Basics · Python · Updated
After this lesson you can
- Turn a size into a guess with a line's intercept and slope, and say what the slope means in the label's units
- Compare two lines by the sum of their squared errors, and explain why least squares picks the line with the smallest sum
Key takeaways
- A straight line guesses a price from a size, the intercept plus the slope times the size, where the slope is dollars per square foot.
- An error is the actual price minus the guess. Squaring each error means none is negative, so errors can't cancel, and a big miss counts much more than a small one.
- The best line by least squares is the one whose squared errors add up to the least. Your textbook may call it ordinary least squares.
- statistics.linear_regression finds that line's slope and intercept from two lists, in plain Python.
A family in the town of Maple Grove is about to sell their 2,000-square-foot home, and they want to know what a fair price would be. Guessing a number from another number is one of the most common jobs in machine learning: a price from a size, a delivery time from a distance, a harvest from the rainfall. You'll use the idea in this lesson every time a model predicts a number.
The example for the whole chapter is Maple Grove Homes: 400 home sales in home_sales.csv, our own made-up data. It comes with Exercise: Home Price Guesser, beside the seed script that made it, so you can run this lesson's code in that folder.
Looking it up doesn't work
The first idea is to find homes of the same size and see what they sold for. Three of the 400 homes are exactly 2,000 square feet, and they sold for $324,000, $334,000 and $285,000. Which one is right? And a home of 2,350 square feet has no sale at all to look up.
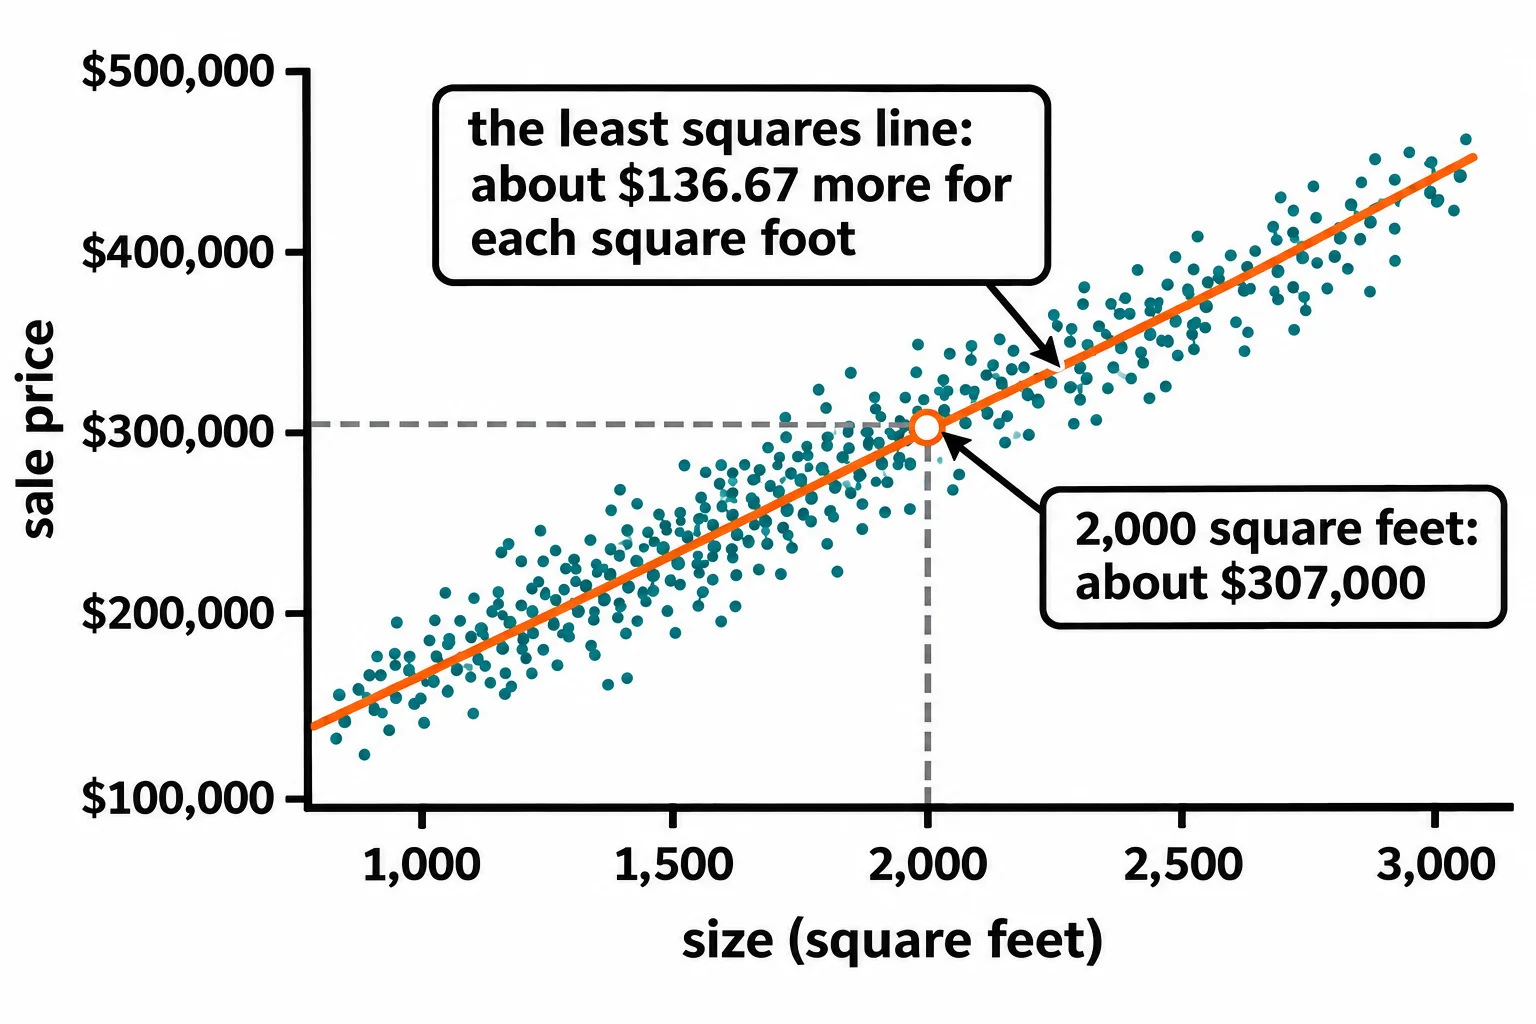
Put every sale on a chart, size across the bottom and price up the side, and a pattern shows: bigger homes sell for more, in a band of dots that rises from left to right. Nobody would lay a ruler through that band so that it misses most of the dots. A ruler laid through the middle of it is a rule you can use for any size, even one nobody has sold.
Slope and intercept
A straight line is two numbers. The slope is how much the price goes up for each extra square foot: dollars per square foot. The intercept is where the line starts, the price it gives at 0 square feet. No home is 0 square feet, so the intercept isn't a price you'd ever pay; it's the starting point the slope builds on. A guess is the intercept plus the slope times the size:
intercept = 40000
slope = 135

for size in [1500, 2000, 2500]:
    guess = intercept + slope * size
    print(size, "square feet:", guess)
1500 square feet: 242500
2000 square feet: 310000
2500 square feet: 377500
Each extra 500 square feet adds 500 × 135 = $67,500. A model that guesses a number with a straight line like this is called linear regression.
Which line is best?
Two neighbors draw two lines. Line A is $155 a square foot with no starting amount: about the town's average price divided by its average size. Line B is $40,000 plus $135 a square foot. To tell which fits better, look at each line's errors: the actual price minus the line's guess. Here are line B's on the first five sales:
| Home | Size | Sold for | Line B's guess | Error | Error squared |
|---|---|---|---|---|---|
| MG-1001 | 2,670 | 402,000 | 400,450 | 1,550 | 2,402,500 |
| MG-1002 | 1,530 | 282,500 | 246,550 | 35,950 | 1,292,402,500 |
| MG-1003 | 870 | 128,000 | 157,450 | −29,450 | 867,302,500 |
| MG-1004 | 1,440 | 244,500 | 234,400 | 10,100 | 102,010,000 |
| MG-1005 | 2,580 | 378,500 | 388,300 | −9,800 | 96,040,000 |
Adding up the errors themselves goes wrong: a guess $30,000 too high and one $30,000 too low cancel out to 0, a perfect score for two bad guesses. So each error is squared (multiplied by itself), which means none of them is negative and a big miss counts far more than a small one. Then they're added up:
sizes = [2670, 1530, 870, 1440, 2580]
prices = [402000, 282500, 128000, 244500, 378500]


def squared_error_total(intercept, slope):
    total = 0
    for size, price in zip(sizes, prices):
        error = price - (intercept + slope * size)
        total += error ** 2
    return total


print("Line A, 0 + 155 per square foot:", squared_error_total(0, 155))
print("Line B, 40,000 + 135 per square foot:", squared_error_total(40000, 135))
Line A, 0 + 155 per square foot: 3155617500
Line B, 40,000 + 135 per square foot: 2360157500
Line B's total is smaller, so it fits these homes better. The totals are huge and in "squared dollars", which mean nothing on their own: they're for comparing lines. Squared Errors and RMSE turns them back into dollars.
The best line of all is the one whose squared errors add up to the least. Finding it is called least squares; your textbook may call it ordinary least squares (OLS). Squaring also lets that best line be worked out exactly with a formula, which is why it's the classic way to fit a line.
Letting Python find the line
Python's statistics module has the formula built in. statistics.linear_regression(x, y) takes the sizes and the prices as two lists, and gives back the slope and intercept of the least squares line. This reads all 400 sales with the csv module:
import csv
import statistics

with open("home_sales.csv", newline="") as file:
    homes = list(csv.DictReader(file))

sizes = [int(home["size_sqft"]) for home in homes]
prices = [int(home["sale_price"]) for home in homes]

slope, intercept = statistics.linear_regression(sizes, prices)
print("Slope:", round(slope, 2))
print("Intercept:", round(intercept, 2))
print("Guess for 2,000 square feet:", round(intercept + slope * 2000))
Slope: 136.67
Intercept: 34026.55
Guess for 2,000 square feet: 307366
About $136.67 for each square foot, from a starting point of about $34,027: the family's 2,000 square feet comes out at about $307,366. The seed script planted $135 a square foot, and the line found 136.67. Close, not exact: each sale has a random wobble, and garages and age move prices too, which this one-feature line can't see.
The line describes the sales it was given. It says bigger homes sold for more in this data; it doesn't say why, and it's no promise about the next sale.
Do it: pick the better price line
Two neighbors in Maple Grove each drew a line to price homes, and you want to know which line fits the sales better.
The inputs:
sizes: each home's size in square feet.prices: what each home sold for, in the same order.interceptandslope: one line's starting amount and its dollars per square foot.line_aandline_b: two lines, each a pair(intercept, slope).
For example, with three homes:
sizes = [1500, 2000, 2500]
prices = [250000, 340000, 395000]
Line A is (50000, 140):
| Size | Sold for | Line A's guess | Error | Error squared |
|---|---|---|---|---|
| 1,500 | 250,000 | 50,000 + 140 × 1,500 = 260,000 | −10,000 | 100,000,000 |
| 2,000 | 340,000 | 50,000 + 140 × 2,000 = 330,000 | 10,000 | 100,000,000 |
| 2,500 | 395,000 | 50,000 + 140 × 2,500 = 400,000 | −5,000 | 25,000,000 |
| Total | 225,000,000 |
So squared_error_total(sizes, prices, 50000, 140) returns 225000000. Line B, (100000, 120), totals 925000000, so better_line(sizes, prices, (50000, 140), (100000, 120)) returns "A".
Your job: write two functions.
squared_error_total(sizes, prices, intercept, slope)returns the sum of the squared errors: for each home, the price minus (intercept + slope × size), squared, all added up.better_line(sizes, prices, line_a, line_b)returns"A"when line A's total is smaller and"B"when line B's is smaller.- If the two totals are equal,
better_linereturns"A".
Practiced live on the lesson page: write the Python right there and check it.
Check yourself
2 questions to try on the lesson page.
So what
A straight line turns one number into a guess for another, and least squares is the honest way to choose it: the line whose squared misses on the real sales add up to the least.
Sources
- Python documentation, statistics.linear_regression: the slope and intercept of simple linear regression, estimated with ordinary least squares, from two sequences of the same length (at least two values, and x not all the same).
- scikit-learn, Linear Models: Ordinary Least Squares, User Guide: a linear model's coefficients are chosen to minimize the residual sum of squares between the observed targets and the line's predictions.
- scikit-learn 1.9.1, LinearRegression, API reference: ordinary least squares linear regression.