Baselines and Residual Plots
A DummyRegressor that always guesses the training average is the baseline a model must beat on the same test set, and a predicted-versus-actual plot and a residual plot show where the misses are, while a pattern in the residuals says the model is missing something it could use.
Journeyman · AI Basics · Python · Updated
After this lesson you can
- Score a DummyRegressor that always guesses the training average as the baseline a model must beat
- Read a predicted-versus-actual plot and a residual plot, and say what a pattern in the residuals means
Key takeaways
- DummyRegressor(strategy="mean") ignores the features and always guesses the training labels' average. It's a baseline, not a model to use.
- Score the baseline and the model on the same test set with the same metrics. A model that can't beat the baseline hasn't learned anything useful from its features.
- On a predicted-versus-actual plot, perfect guesses sit on the diagonal line. The farther a point is from it, the bigger the miss.
- A residual plot shows each test example's error against its guess. A good one is a flat band around 0 with no shape.
- A pattern in the residuals, a curve or misses that grow or move with a feature, says the model is missing something it could use.
A teammate says, "My model's MAE is 3.63 minutes." Before anyone celebrates, two questions: would a guess with no model at all have done nearly as well, and where are the misses: everywhere a little, or a few orders a lot? A score alone answers neither. Whenever you hand in or review a model, at work or in a project, a baseline in the table and a look at the misses are what make its numbers believable.
The example is Pine Ridge Delivery's deliveries.csv, from Exercise: Delivery Time Errors. Each code block is one notebook cell, run in order: the first loads the data, and the others use what it made.
The guess to beat
R Squared: Better Than Guessing the Average? compared the model with always guessing the average. scikit-learn has that guess as an estimator of its own, DummyRegressor, so it can be trained and scored exactly like a model. With strategy="mean", its fit learns the training labels' average, and its predict gives that average for every row, whatever the features say:
import pandas as pd
from sklearn.dummy import DummyRegressor
from sklearn.linear_model import LinearRegression
from sklearn.metrics import mean_absolute_error, r2_score, root_mean_squared_error
from sklearn.model_selection import train_test_split

deliveries = pd.read_csv("deliveries.csv")
features = ["distance_miles", "stops_before", "is_raining"]
train, test = train_test_split(deliveries, test_size=0.2, random_state=42)

baseline = DummyRegressor(strategy="mean")
baseline.fit(train[features], train["minutes"])
print("The baseline's first three guesses:", baseline.predict(test[features])[:3])
The baseline's first three guesses: [28.4225 28.4225 28.4225]
28.4225 minutes for every order: the average of the 400 training orders. A guess like this, the simplest one that's still fair, is called a baseline. Other strategies guess the median ("median") or a number you choose ("constant"). scikit-learn's own advice is to use it only for comparing, never for real guesses.
Same test set, same metrics
A comparison is fair only when both are trained on the same training orders and scored on the same test orders with the same metrics:
model = LinearRegression()
model.fit(train[features], train["minutes"])

for name, estimator in [("baseline", baseline), ("linear model", model)]:
    guesses = estimator.predict(test[features])
    mae = mean_absolute_error(test["minutes"], guesses)
    rmse = root_mean_squared_error(test["minutes"], guesses)
    r2 = r2_score(test["minutes"], guesses)
    print(name, "MAE:", round(mae, 2), "RMSE:", round(rmse, 2), "R squared:", round(r2, 2))
baseline MAE: 8.26 RMSE: 10.41 R squared: -0.04
linear model MAE: 3.63 RMSE: 5.72 R squared: 0.69
The baseline is off by 8.26 minutes on average; the model cuts that to 3.63. Now "3.63 minutes" means something: distance, stops and rain really do help. A model whose numbers sit close to the baseline's hasn't learned much from its features, however good its score sounds alone.
Seeing the misses
Numbers summarize; a chart shows where the misses are. The first chart puts each test order's guess across the bottom and its real minutes up the side, with a diagonal line where they'd be equal:
import matplotlib.pyplot as plt

guesses = model.predict(test[features])
plt.scatter(guesses, test["minutes"])
plt.plot([0, 60], [0, 60], color="orange")
plt.xlabel("guessed minutes")
plt.ylabel("actual minutes")
plt.show()
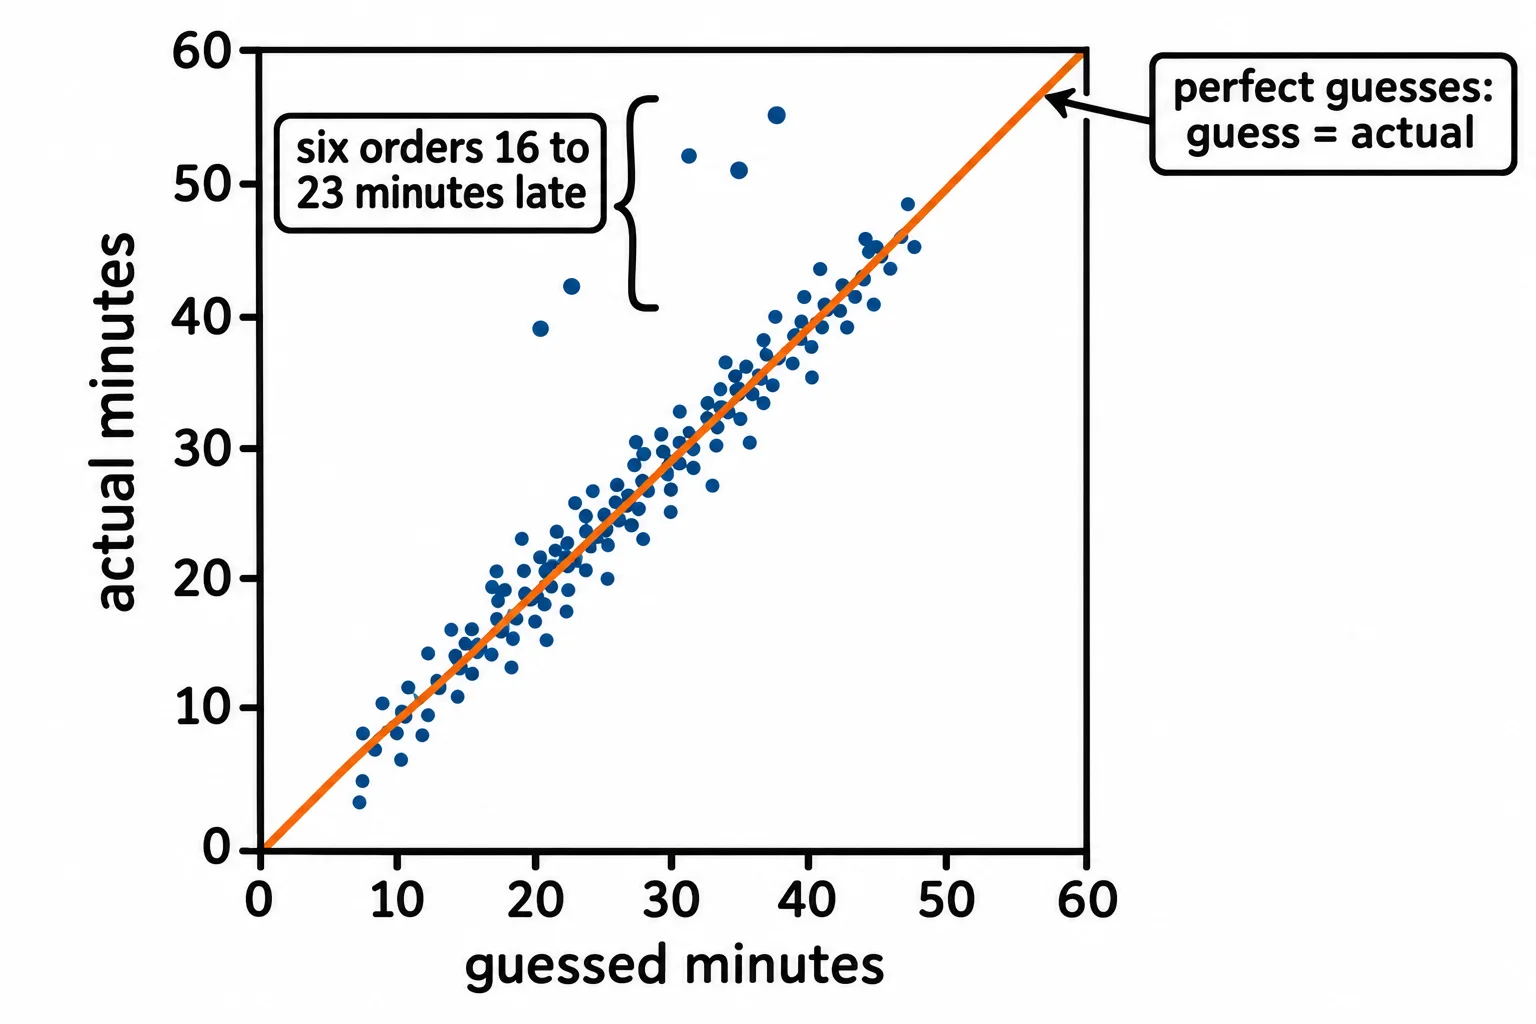
A perfect guess sits on the line; the farther a dot is from it, the bigger the miss. Most dots hug the line. Six sit far above it: orders that took much longer than the app said.
The second chart is a residual plot: each order's residual (actual minus guess) up the side, against its guess across the bottom. scikit-learn draws it with PredictionErrorDisplay:
from sklearn.metrics import PredictionErrorDisplay

PredictionErrorDisplay.from_predictions(test["minutes"], guesses, kind="residual_vs_predicted")
plt.show()
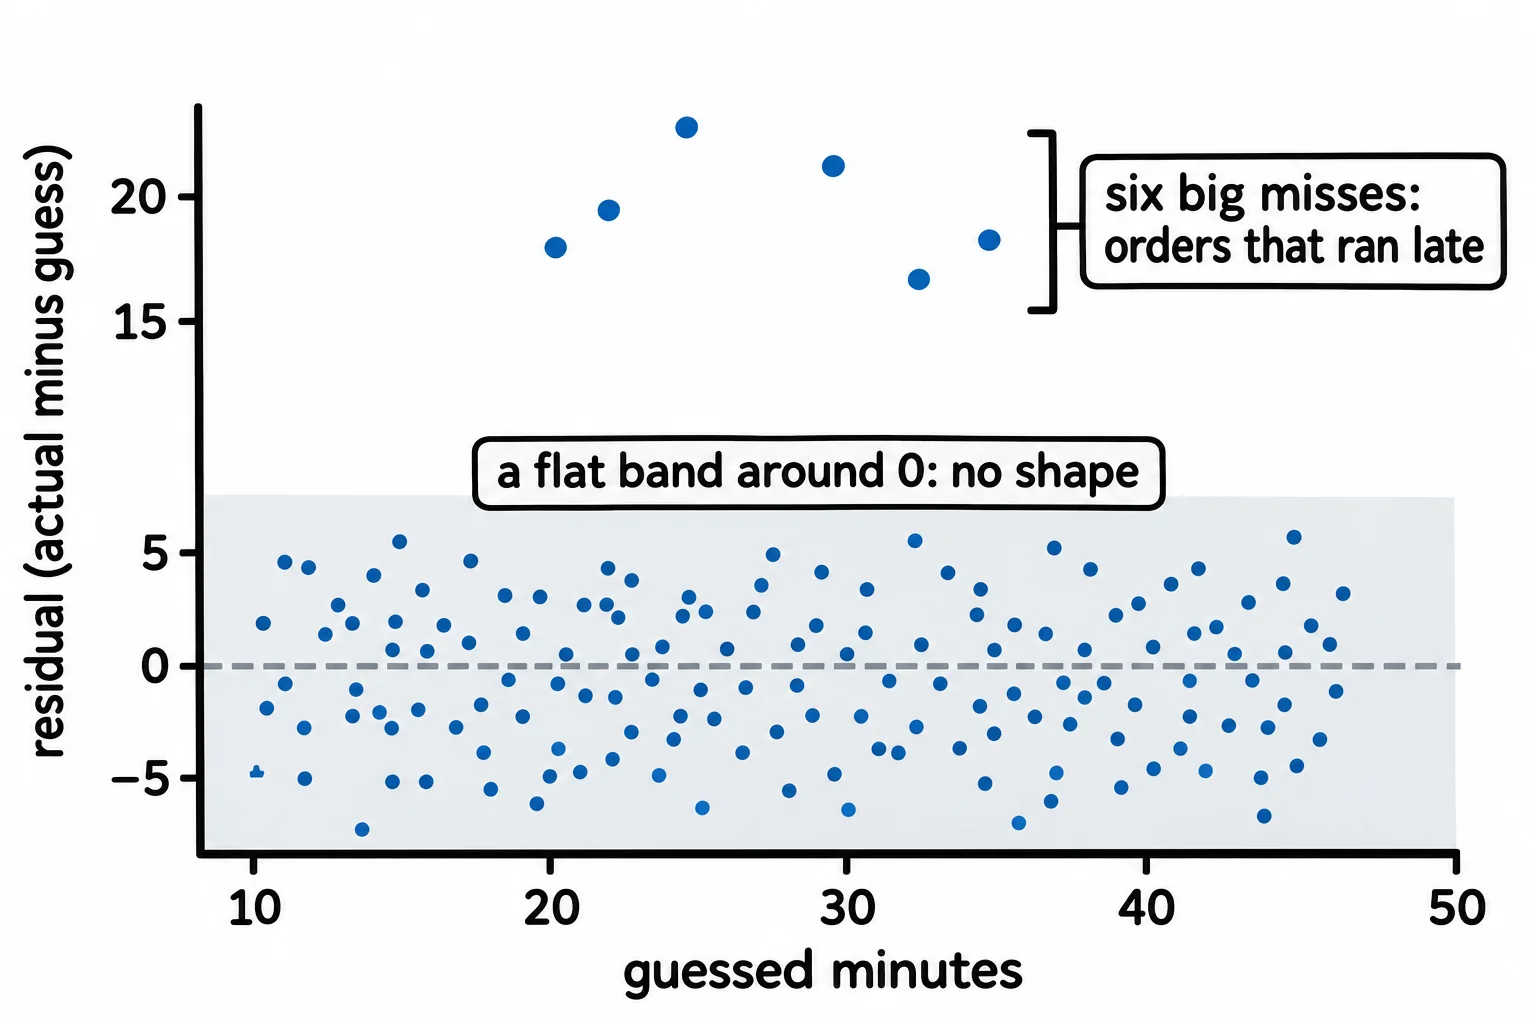
Here's what to look for: a flat band around 0, as wide at the left as at the right, with no curve. This model's band is like that, so a straight line suits these orders. The six dots high above the band are the traffic jams from Squared Errors and RMSE: misses no column in the data can explain.
When the residuals have a pattern
A pattern in the residuals means the model is missing something it could use. Train a model on distance alone, then average its residuals by how many stops the driver makes first:
distance_only = LinearRegression()
distance_only.fit(train[["distance_miles"]], train["minutes"])
leftover = test["minutes"] - distance_only.predict(test[["distance_miles"]])
for stops in range(4):
    print("Stops first:", stops, "average residual:", round(leftover[test["stops_before"] == stops].mean(), 1))
Stops first: 0 average residual: -4.5
Stops first: 1 average residual: -2.9
Stops first: 2 average residual: 4.6
Stops first: 3 average residual: 4.5
With no stops, this model guesses about 4.5 minutes too long; with three, about 4.5 too short. The residuals move with a feature it never saw, a sign to add stops_before. Other patterns say the same: residuals that curve like a smile or a frown say a straight line doesn't fit (Beyond a Straight Line fixes that), and a band that widens as the guesses grow says the misses aren't the same size everywhere, so one MAE hides that the model's long-order guesses are less reliable than its short ones. The plot shows what the model misses, not why; finding the cause is your job.
Check yourself
2 questions to try on the lesson page.
So what
A score needs a baseline beside it, scored on the same test set, before it means anything, and a residual plot shows whether the misses are random noise or a pattern the model could still learn.
Sources
- scikit-learn 1.9.1, DummyRegressor, API reference: a regressor that makes predictions using simple rules, useful as a simple baseline to compare with other regressors and not for real problems;
strategyis"mean"(the default),"median","quantile"or"constant". - scikit-learn, Metrics and scoring: Dummy estimators, User Guide: comparing an estimator against simple rules of thumb is a sanity check;
"mean"always predicts the mean of the training targets, andpredictignores the input data. - scikit-learn 1.9.1, PredictionErrorDisplay, API reference: draws residuals against predicted values (
kind="residual_vs_predicted", the default) or actual against predicted values, preferably on held-out data. - scikit-learn, Metrics and scoring: Visual evaluation of regression models, User Guide: a perfect model's points lie on the diagonal, and the farther from it the larger the error; for linear least squares models the residuals should average 0 with a constant spread, and a curved, banana-shaped residual plot hints that the model is misspecified and a non-linear feature or model might help.