Moving the Threshold
Lowering a classifier's threshold below 0.5 flags more payments, so recall goes up and precision usually goes down, precision_recall_curve and PrecisionRecallDisplay show the whole trade, and you choose the threshold from what each mistake costs, on validation data set aside for choosing, then score the test data once.
Freelancer · AI Basics · Python · Updated
After this lesson you can
- Turn predict_proba's chances into labels at a threshold, and explain how lowering the threshold trades precision for recall
- Choose a threshold from what each kind of mistake costs, on validation data, and score the test data only once with it
Key takeaways
- The threshold is the line on predict_proba's chance where a payment gets flagged. predict uses 0.5, and you can use any other.
- Lowering the threshold flags more payments, so more fraud is caught (recall up) and more honest payments are flagged (precision usually down).
- precision_recall_curve gives precision and recall at every threshold, and PrecisionRecallDisplay draws them as a curve.
- Choose the threshold from what each mistake costs, on validation data. The test data is for the final check only, or its score stops being honest.
- TunedThresholdClassifierCV does the same search with cross-validation, scoring each threshold with the metric you give it.
Northside Credit Union's fraud check catches 8 of every 20 frauds, and Precision and Recall worked out what the other 12 cost: $1,661.51 on the test payments. The finance manager asks the natural question: "Can't it flag more?" It can, without training anything new. Every classifier that gives a probability has a dial, and deciding where to set it is one of the most practical decisions in machine learning: you'll make it for fraud checks, spam filters, screening tests and any model whose two kinds of mistakes cost different amounts.
The example is still transactions.csv, from Exercise: Fraud Check Scorecard.
The line on the chance
Probabilities and the 0.5 Line showed that predict_proba gives each row a chance of each class, and that predict calls a row the positive class when its chance is above 0.5. That 0.5 is the threshold, and nothing about fraud says it should be 0.5. A payment with a 30% chance of fraud is worth a phone call when a missed fraud costs hundreds of dollars.
But choosing the threshold is choosing, and Training and Testing: Never Grade Your Own Homework has a rule for that: anything chosen by looking at the test data makes the test score look better than it will be. So this lesson splits the payments three ways. Validation data is held back from training for choosing, here the threshold; the test data stays untouched for one final check. (Validation Sets: Keep the Test Set for Last, in Module 4, goes further.)
import pandas as pd
from sklearn.linear_model import LogisticRegression
from sklearn.model_selection import train_test_split

payments = pd.read_csv("transactions.csv")
features = ["amount", "hour", "miles_from_home", "new_merchant", "online"]
rest, test = train_test_split(
    payments, test_size=0.2, random_state=42, stratify=payments["is_fraud"]
)
train, valid = train_test_split(
    rest, test_size=0.25, random_state=42, stratify=rest["is_fraud"]
)
print("Training:", len(train))
print("Validation:", len(valid))
print("Test:", len(test))

model = LogisticRegression()
model.fit(train[features], train["is_fraud"])
chances = model.predict_proba(valid[features])[:, 1]
Training: 3000
Validation: 1000
Test: 1000
The test part is the same 1,000 payments as the rest of the chapter; the other 4,000 are split into 3,000 for training and 1,000 for validation, each with 20 frauds (a quarter of 4,000 is 1,000). Column 1 of predict_proba is the chance of fraud, because classes_ is [0, 1].
The trade
Here's the validation data at five thresholds. A payment is flagged when its chance is at or above the line:
from sklearn.metrics import precision_score, recall_score

for threshold in [0.5, 0.2, 0.1, 0.05, 0.02]:
    flags = (chances >= threshold).astype(int)
    p = precision_score(valid["is_fraud"], flags)
    r = recall_score(valid["is_fraud"], flags)
    print(f"{threshold}: {flags.sum()} flagged, precision {p:.2f}, recall {r:.2f}")
0.5: 11 flagged, precision 0.91, recall 0.50
0.2: 15 flagged, precision 0.73, recall 0.55
0.1: 28 flagged, precision 0.50, recall 0.70
0.05: 38 flagged, precision 0.42, recall 0.80
0.02: 75 flagged, precision 0.24, recall 0.90
Lowering the line flags more payments. Recall can only go up, because every fraud flagged at 0.5 is still flagged at 0.2, plus some new ones. Precision usually goes down, because the payments a little above a low line are mostly honest. Neither end is free: at 0.5 the check misses half the fraud, and at 0.02 three flags in four are false alarms.
precision_recall_curve(y_true, chances) works out precision and recall at every threshold the chances allow, and PrecisionRecallDisplay draws them:
import matplotlib.pyplot as plt
from sklearn.metrics import PrecisionRecallDisplay

PrecisionRecallDisplay.from_predictions(valid["is_fraud"], chances)
plt.show()
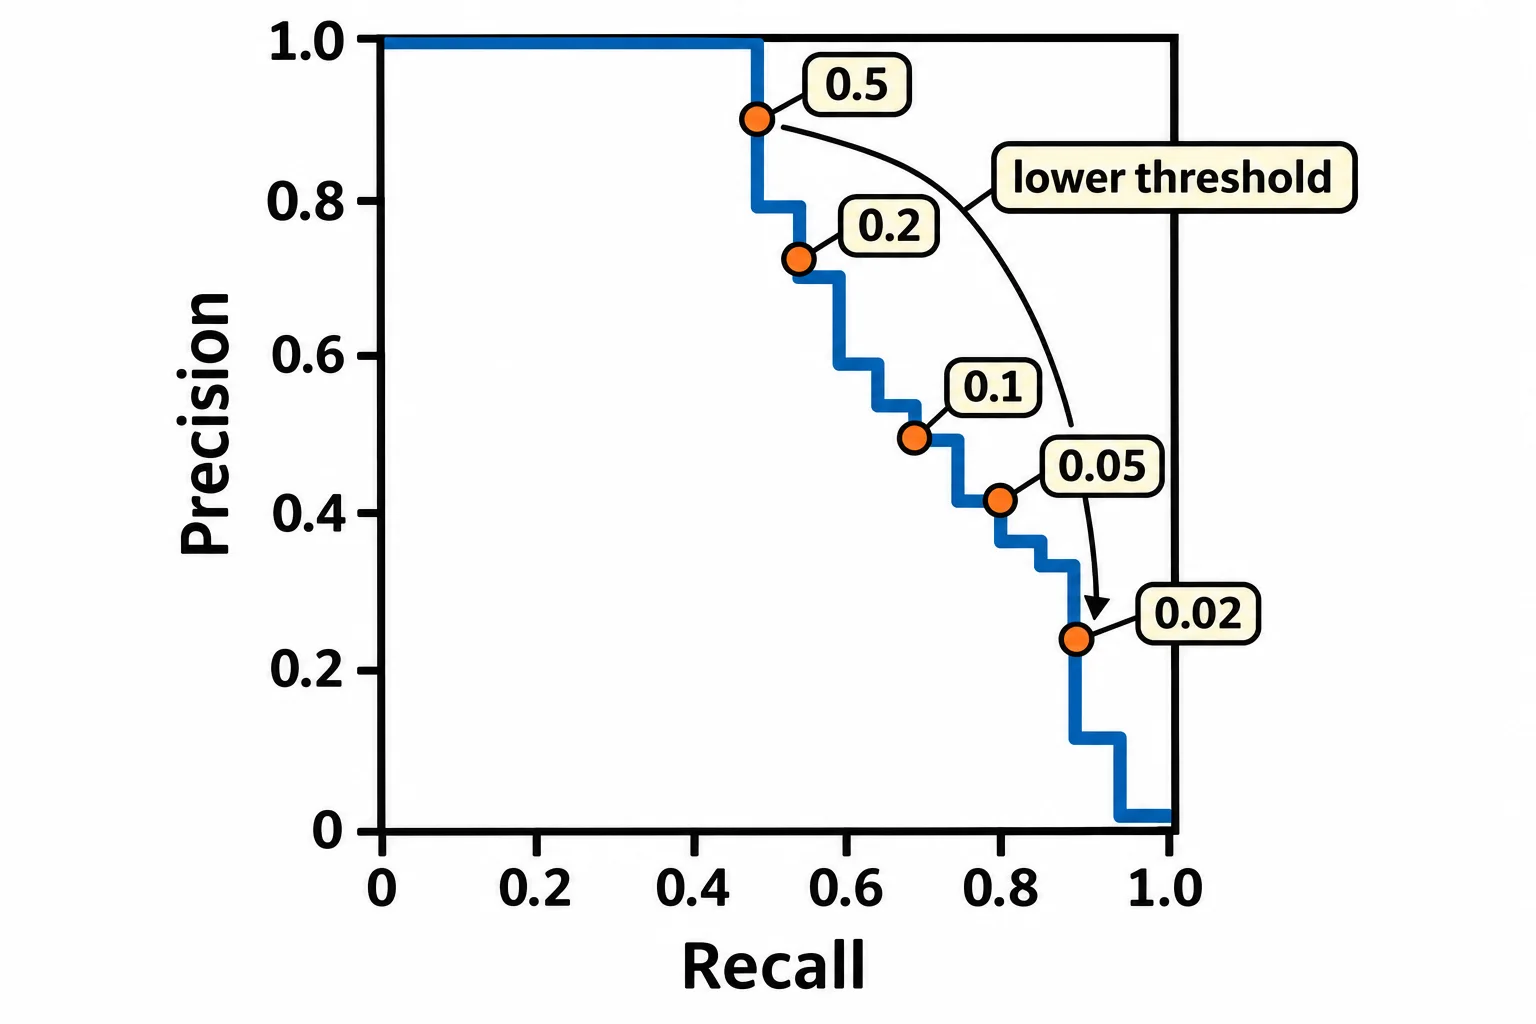
Each point on the curve is one threshold (the picture marks the five from the table; your own plot shows the curve without the marks): moving right catches more fraud, and moving down means more false alarms per flag. The legend's AP, average precision, sums the whole curve up in one number; this course reads the curve instead. You'll also meet the ROC curve, which plots the true positive rate against the false positive rate; with fraud this rare, the precision-recall curve shows the false alarms more plainly, so it's the one used here.
Choosing by cost
The curve shows the choices; the costs make the choice. Say the fraud team estimates that a missed fraud costs about $200 (the refund) and a false alarm about $20 (a staff member's call, and an annoyed member). The cost at a threshold is $200 for each fraud missed plus $20 for each false alarm:
from sklearn.metrics import confusion_matrix

for threshold in [0.5, 0.2, 0.1, 0.05, 0.02]:
    flags = (chances >= threshold).astype(int)
    tn, fp, fn, tp = confusion_matrix(valid["is_fraud"], flags).ravel()
    cost = 200 * fn + 20 * fp
    print(f"{threshold}: missed {fn}, false alarms {fp}, cost ${cost:,}")
0.5: missed 10, false alarms 1, cost $2,020
0.2: missed 9, false alarms 4, cost $1,880
0.1: missed 6, false alarms 14, cost $1,480
0.05: missed 4, false alarms 22, cost $1,240
0.02: missed 2, false alarms 57, cost $1,540
0.05 is the cheapest on the validation payments. Different costs pick a different line: if false alarms cost more, the best threshold moves up. Now, once, the test payments:
test_chances = model.predict_proba(test[features])[:, 1]
test_flags = (test_chances >= 0.05).astype(int)
print(confusion_matrix(test["is_fraud"], test_flags))
print("Precision:", round(precision_score(test["is_fraud"], test_flags), 3))
print("Recall:", recall_score(test["is_fraud"], test_flags))
[[948  32]
 [  3  17]]
Precision: 0.347
Recall: 0.85
17 of the 20 test frauds caught instead of 8, for 32 false alarms. That's the honest score to report, because nothing was chosen by looking at it. If you didn't like it, going back to try another threshold on the test data would make it dishonest.
scikit-learn can run this search for you: TunedThresholdClassifierCV tries thresholds with cross-validation (Module 4) and keeps the one with the best score on the metric you give it, balanced accuracy unless you say otherwise. Doing it by hand first shows you what it does.
Do it: find the cheapest threshold
The fraud team has its model's chances of fraud for some validation payments, and it wants the threshold that costs the least.
The inputs:
chances: the model's chance of fraud for each payment, between 0 and 1.actual: what each payment really was, 1 for fraud and 0 for honest, in the same order.threshold: the line. A payment is flagged when its chance is at or above it.miss_cost: what one missed fraud costs, andalarm_cost: what one false alarm costs.thresholds: the lines to try, in the order given.
For example:
chances = [0.9, 0.6, 0.35, 0.3, 0.2, 0.05]
actual = [1, 0, 1, 0, 1, 0]
with a missed fraud at 100 and a false alarm at 10:
| Threshold | Flagged | Frauds missed | False alarms | Cost |
|---|---|---|---|---|
| 0.5 | 0.9, 0.6 | 2 (0.35 and 0.2) | 1 (0.6) | 2 × 100 + 1 × 10 = 210 |
| 0.3 | 0.9, 0.6, 0.35, 0.3 | 1 (0.2) | 2 (0.6 and 0.3) | 1 × 100 + 2 × 10 = 120 |
| 0.1 | all but 0.05 | 0 | 2 (0.6 and 0.3) | 0 × 100 + 2 × 10 = 20 |
So cost_at(chances, actual, 0.3, 100, 10) returns 120, and best_threshold(chances, actual, [0.5, 0.3, 0.1], 100, 10) returns 0.1.
Your job: write two functions.
cost_at(chances, actual, threshold, miss_cost, alarm_cost)returnsmiss_costtimes the frauds not flagged, plusalarm_costtimes the honest payments flagged.- A payment is flagged when its chance is at or above the threshold (
>=). best_threshold(chances, actual, thresholds, miss_cost, alarm_cost)returns the threshold fromthresholdswhose cost is lowest.- If two thresholds tie for the lowest cost,
best_thresholdreturns the one that comes first inthresholds.
Practiced live on the lesson page: write the Python right there and check it.
Check yourself
2 questions to try on the lesson page.
So what
The 0.5 line is only scikit-learn's default; the right threshold comes from what each mistake costs, chosen on validation data, so the test score you report is still one the model hasn't been tuned to.
Sources
- scikit-learn, Tuning the decision threshold for class prediction, User Guide: for binary classification,
predictcalls the positive class when the probability frompredict_probais greater than 0.5, which is not ideal for most uses; when a missed positive costs much more than a false positive, a threshold well below 0.5 can be better, at the price of more false positives;TunedThresholdClassifierCVtunes the threshold with an internal cross-validation to maximize a given metric, balanced accuracy by default; the same data should never be used both to train the classifier and to tune its threshold. - scikit-learn 1.9.1, precision_recall_curve, API reference: precision and recall for predictions with a score greater than or equal to each threshold, with the thresholds in increasing order and recall decreasing.
- scikit-learn 1.9.1, PrecisionRecallDisplay, API reference:
from_predictionsplots a precision-recall curve from the true labels and the predicted scores, and shows the average precision in its legend. - scikit-learn, Metrics and scoring: Precision, recall and F-measures, User Guide:
precision_recall_curvecomputes a precision-recall curve by varying a decision threshold;roc_curvecomputes the receiver operating characteristic (ROC) curve.