Seeing It: Validation and Learning Curves
A validation curve draws a model's training score and validation score for each value of one setting, such as a tree's max_depth, so you can see where underfitting ends and overfitting begins, and a learning curve draws the same two scores for more and more training rows, to show whether more data would help.
Freelancer · AI Basics · Python · Updated
After this lesson you can
- Draw a validation curve over one setting with ValidationCurveDisplay, and read where underfitting ends and overfitting begins
- Read a learning curve from LearningCurveDisplay, and say whether more training rows would help
Key takeaways
- ValidationCurveDisplay draws the training score and the validation score for each value of one setting, such as max_depth from 1 to 12.
- Where both lines are low, the model underfits. Where the training line keeps rising and the validation line falls, it overfits. Choose near the top of the validation line.
- LearningCurveDisplay draws the two scores for more and more training rows. A gap that shrinks as rows are added says more data would help.
- When both lines level off close together, more of the same data won't help much. A better model or better features would.
- scikit-learn's charts label the validation line "Test". In this course it's validation, because you choose with it.
Overfitting and Underfitting tried three depths for Lakeside Cinema's tree: 1, 5 and no limit. Why stop at three? A depth of 4 or 6 might do better, and trying them one cell at a time is slow. When you tune a model, for a project or a job, you want every value of a setting on one chart, with the two scores side by side, so the best region shows itself. And before you ask for more data, which can cost weeks of collecting, you want to know whether it would help.
The example is Lakeside Cinema's showings.csv, from Exercise: Honest Scores. Each code block is one notebook cell, run in order: the first one loads the data, and the others use what it made.
A score for every depth
The 180 test showings are put away, as before, and stay away: the curves are drawn from the 720 training showings only.
import pandas as pd
from sklearn.model_selection import KFold, LearningCurveDisplay, ValidationCurveDisplay, train_test_split
from sklearn.tree import DecisionTreeRegressor

showings = pd.read_csv("showings.csv")
features = ["day_number", "weekday", "start_hour", "is_new_release", "screen_seats"]
X_train, X_test, y_train, y_test = train_test_split(
    showings[features], showings["tickets_sold"], test_size=0.2, random_state=42
)
folds = KFold(n_splits=5, shuffle=True, random_state=0)
The validation score has to come from showings each tree didn't learn from. folds makes that happen: it splits the 720 training showings five ways, so each tree learns from four parts and is scored on the fifth, five times over, and the five scores are averaged. Cross-Validation, the next lesson, takes that apart step by step; for now, read the validation score as "R² on showings this tree never saw".
ValidationCurveDisplay.from_estimator takes the model, the rows, the setting's name and the values to try:
curve = ValidationCurveDisplay.from_estimator(
    DecisionTreeRegressor(random_state=0), X_train, y_train,
    param_name="max_depth", param_range=range(1, 13), cv=folds,
)
table = pd.DataFrame({
    "max_depth": curve.param_range,
    "training R²": curve.train_scores.mean(axis=1),
    "validation R²": curve.test_scores.mean(axis=1),
}).set_index("max_depth").round(2)
print(table)
           training R²  validation R²
max_depth
1                 0.34           0.33
2                 0.57           0.56
3                 0.66           0.62
4                 0.72           0.66
5                 0.78           0.70
6                 0.83           0.69
7                 0.88           0.64
8                 0.92           0.59
9                 0.95           0.56
10                0.97           0.52
11                0.99           0.51
12                0.99           0.50
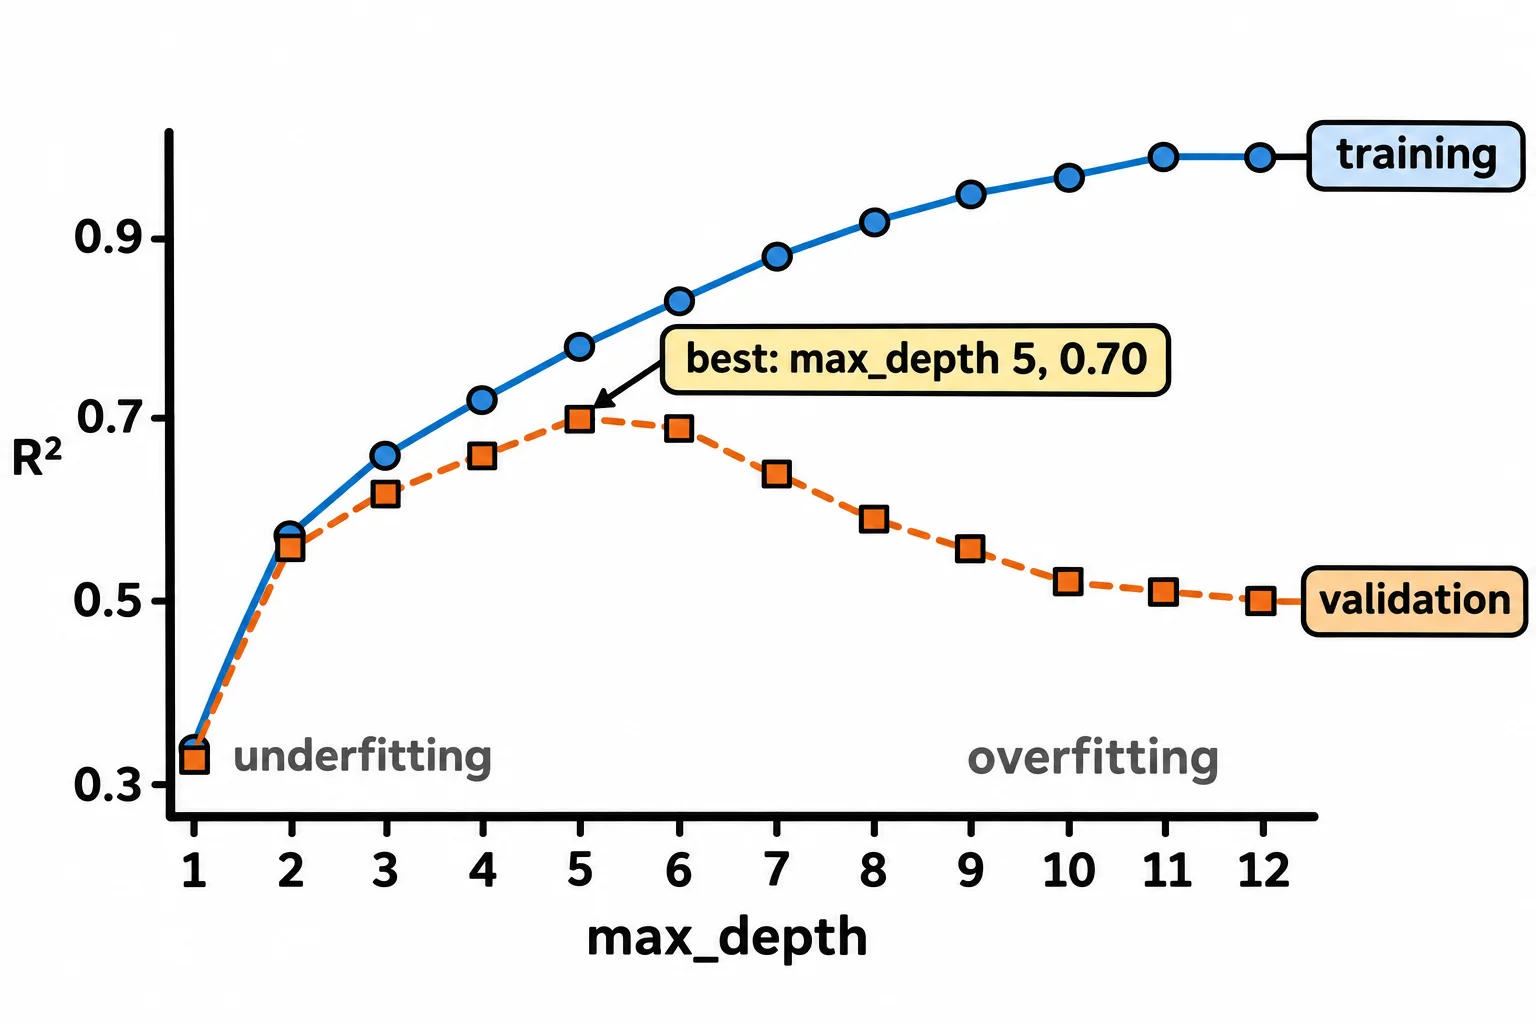
In a notebook, the cell also draws the chart below. curve.train_scores holds each depth's five training scores and curve.test_scores its five validation scores; .mean(axis=1) averages each row of five.
Reading where the lines part
- Depths 1 to 3: both lines low and close together. Underfitting.
- Depth 5: the validation line's peak, 0.70. The two lines have started to part, a little.
- Depths 7 to 12: the training line climbs toward 0.99 while the validation line falls. Each extra level learns more of the training showings' wobble. Overfitting.
So the chart suggests a depth near 5: the top of the validation line, not of the training line. One thing to know about scikit-learn's chart: its legend labels the two lines "Train" and "Test". It's the same idea under another name; this course calls the second line validation, because you use it to choose, and Validation Sets: Keep the Test Set for Last explains why the difference matters.
Would more showings help?
A learning curve keeps the setting fixed and changes the number of training rows instead:
learning = LearningCurveDisplay.from_estimator(
    DecisionTreeRegressor(max_depth=5, random_state=0), X_train, y_train,
    train_sizes=[0.2, 0.4, 0.6, 0.8, 1.0], cv=folds,
)
print(pd.DataFrame({
    "training showings": learning.train_sizes,
    "training R²": learning.train_scores.mean(axis=1),
    "validation R²": learning.test_scores.mean(axis=1),
}).set_index("training showings").round(2))
                   training R²  validation R²
training showings
115                       0.87           0.52
230                       0.82           0.60
345                       0.81           0.65
460                       0.78           0.69
576                       0.78           0.70
train_sizes are shares of the rows each tree may learn from: four of the five parts, 576 showings. With 115 showings the gap is wide, 0.87 against 0.52: too few rows, and the tree learns their quirks. As showings are added, the training line comes down and the validation line goes up, and from 460 on, both have nearly leveled off, 0.78 and 0.70.
That's how to read any learning curve:
- A gap that's still closing at the right edge: more data of the same kind would probably help.
- Two lines that have leveled off close together: more of the same rows won't help much. A different model, or features that carry more of the pattern, would. This tree is near that point;
genre, still unused, is one feature it doesn't have yet.
Check yourself
2 questions to try on the lesson page.
So what
A validation curve shows where a setting stops helping and starts memorizing, and a learning curve tells you whether to go and collect more data, both from scores on rows the model never saw.
Sources
- scikit-learn, Validation curves: plotting scores to evaluate models, User Guide: a validation curve plots one hyperparameter's effect on the training and validation scores; both low means underfitting, a high training score with a low validation score means overfitting; a learning curve shows both scores for varying numbers of training samples, to see how much more data helps; when both converge to a low value, more training data probably won't help much.
- scikit-learn 1.9.1, ValidationCurveDisplay, API reference:
from_estimatorwithparam_name,param_rangeandcv;train_scoresandtest_scoreshold one row per value and one column per fold; added in version 1.3. - scikit-learn 1.9.1, LearningCurveDisplay, API reference:
train_sizesas fractions of the largest training set,train_scoresandtest_scoreswith one row per size; added in version 1.2. - scikit-learn, Cross-validation: evaluating estimator performance, User Guide: in k-fold cross-validation a model is trained on k − 1 folds and validated on the remaining one, and the scores are averaged.