DataFrames: Rows, Columns and the Index
A DataFrame is pandas' table, and shape, columns and dtypes describe it, df['col'] picks one column as a Series, df[['a', 'b']] picks several as a smaller table, a new column can be made from two others in one line, and the index labels every row.
Apprentice · Python · Updated
After this lesson you can
- Read a DataFrame's shape, columns and dtypes, and pick one column as a Series or several as a DataFrame
- Add a new column calculated from two other columns, such as units times price
Key takeaways
- A DataFrame is pandas' table, with named columns, a dtype for each column and a label for each row, called the index.
- shape gives the rows and columns as a pair, columns lists the column names, and dtypes lists each column's type. In pandas 3, text shows as str.
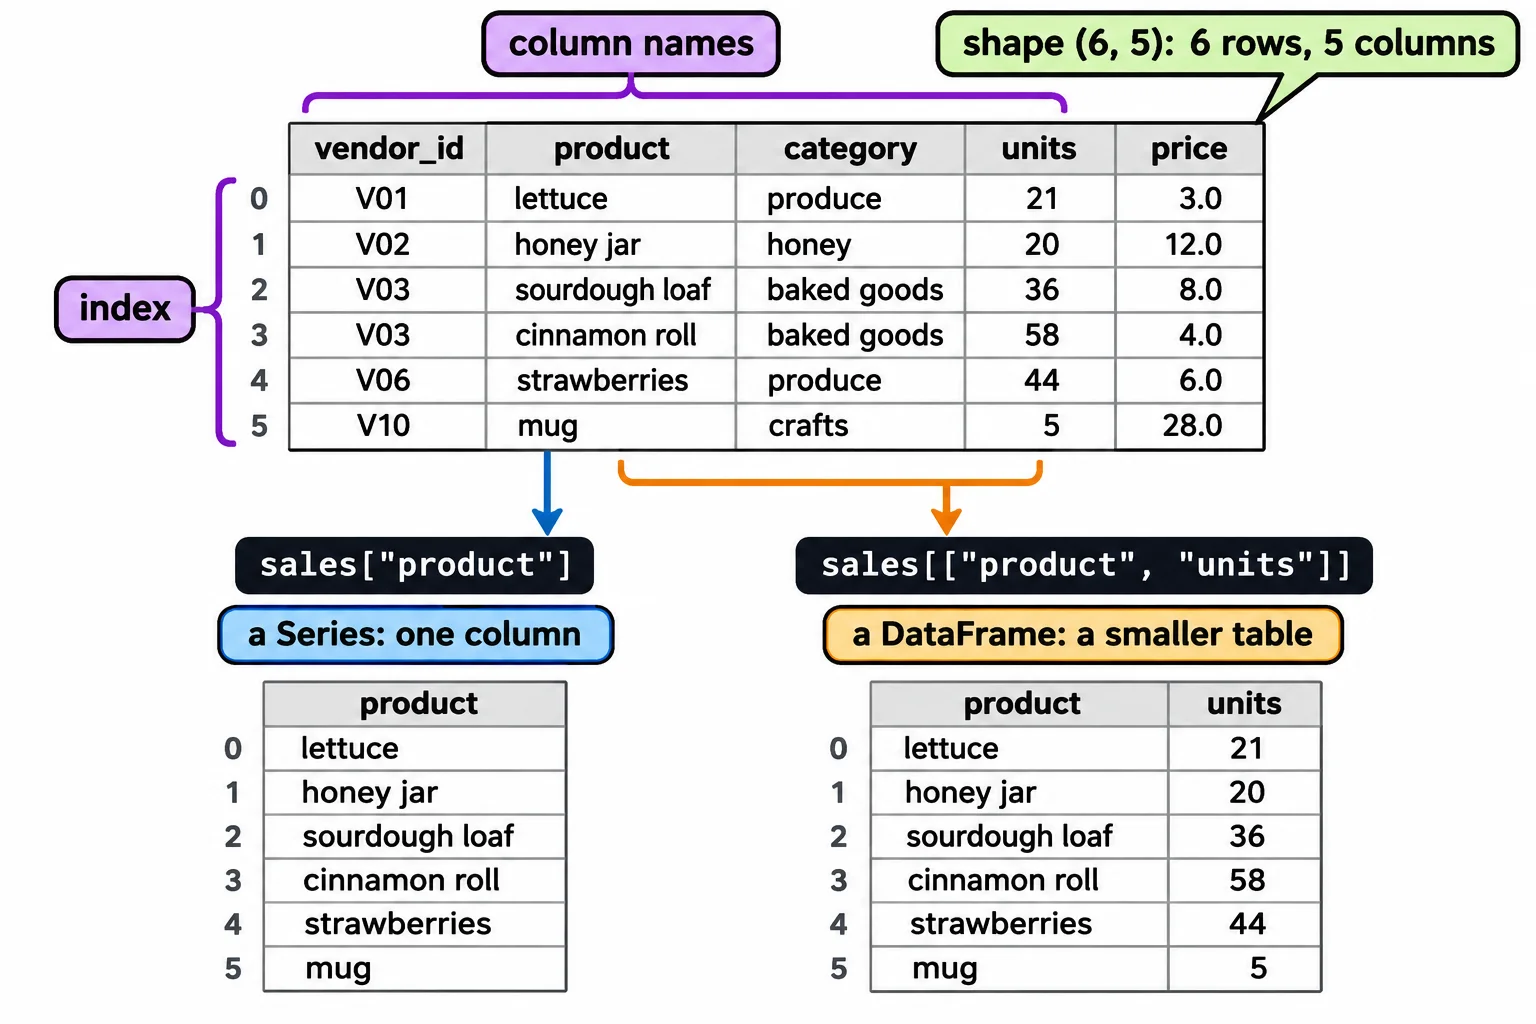
- One name in square brackets, df["product"], gives one column as a Series. A list of names, df[["product", "units"]], gives a smaller DataFrame.
- df["sale_total"] = df["units"] * df["price"] makes a new column from two others, row by row, in one line.
Nearly every dataset you'll meet is a table: a class's survey results, a store's sales, a sensor's readings. Before you can answer anything with one, you need to know how big it is, what its columns are called, what kind of values they hold, and how to pull out the columns a question needs. That's this lesson, and you'll use all of it on every table after.
The example is one Saturday at Sunnyside Farmers Market, a weekly market whose vendors sell produce, baked goods, flowers, honey and crafts: six of its sales, each with the vendor's id, the product, its category, how many units sold and the price of one. The market is our own made-up data.
A table in Python
pandas is the Python library for tables, imported as pd (read "p d"), the short name almost everyone uses. Give pd.DataFrame a dictionary: each key is a column's name, and its list holds that column's values, top to bottom.
import pandas as pd

sales = pd.DataFrame({
    "vendor_id": ["V01", "V02", "V03", "V03", "V06", "V10"],
    "product": ["lettuce", "honey jar", "sourdough loaf", "cinnamon roll", "strawberries", "mug"],
    "category": ["produce", "honey", "baked goods", "baked goods", "produce", "crafts"],
    "units": [21, 20, 36, 58, 44, 5],
    "price": [3.00, 12.00, 8.00, 4.00, 6.00, 28.00],
})
sales
  vendor_id         product     category  units  price
0       V01         lettuce      produce     21    3.0
1       V02       honey jar        honey     20   12.0
2       V03  sourdough loaf  baked goods     36    8.0
3       V03   cinnamon roll  baked goods     58    4.0
4       V06    strawberries      produce     44    6.0
5       V10             mug       crafts      5   28.0
That's a DataFrame, pandas' table. VS Code draws it as a grid; this lesson shows it as pandas prints it as text. The numbers down the left aren't a column of the data: they're the row labels, which the last section explains.
Its size, its columns and their types
Three questions come first with any table: how big is it, what are the columns called, and what kind of values do they hold?
print(sales.shape)
print(sales.columns)
(6, 5)
Index(['vendor_id', 'product', 'category', 'units', 'price'], dtype='str')
shape is a pair, rows first: 6 rows and 5 columns. columns lists the names, spelled exactly as code must spell them. dtypes gives each column's type (its dtype):
sales.dtypes
vendor_id        str
product          str
category         str
units          int64
price        float64
dtype: object
int64 is whole numbers, float64 numbers with decimals, and str text. In pandas 3, text shows as str; older tutorials and answers online show object. A number column that shows str is worth a second look: something in it isn't a number.
One column or several
One column's name in square brackets gives that column, as a Series, pandas' type for a single column:
sales["product"]
0           lettuce
1         honey jar
2    sourdough loaf
3     cinnamon roll
4      strawberries
5               mug
Name: product, dtype: str
For several columns, put a list of names inside the brackets: two pairs of brackets, the outer pair for "pick" and the inner pair for the list. The result is a smaller DataFrame:
sales[["product", "units"]]
          product  units
0         lettuce     21
1       honey jar     20
2  sourdough loaf     36
3   cinnamon roll     58
4    strawberries     44
5             mug      5
Two slips are common. A name spelled differently, sales["Product"], stops with KeyError: 'Product', because names match exactly, capital letters included. And two names with one pair of brackets, sales["product", "units"], stops with KeyError: ('product', 'units'): without the inner list, pandas looks for one column with that whole pair as its name.
A new column from two others
What did each sale bring in? Multiply two columns and pandas multiplies them row by row, so row 0's units times row 0's price, and so on down. Assigning the result to a new name adds the column:
sales["sale_total"] = sales["units"] * sales["price"]
sales
  vendor_id         product     category  units  price  sale_total
0       V01         lettuce      produce     21    3.0        63.0
1       V02       honey jar        honey     20   12.0       240.0
2       V03  sourdough loaf  baked goods     36    8.0       288.0
3       V03   cinnamon roll  baked goods     58    4.0       232.0
4       V06    strawberries      produce     44    6.0       264.0
5       V10             mug       crafts      5   28.0       140.0
No loop, and the same line works for six rows or six thousand. Assigning to a name that's already a column replaces that column instead.
The index
The numbers down the left are the DataFrame's index: a label for each row, like the numbers printed down the side of a spreadsheet.
sales.index
RangeIndex(start=0, stop=6, step=1)
RangeIndex is pandas' way of saying "the labels count from 0 up to, not including, 6". Every column you take out keeps the same labels, which is how units and price lined up row by row a moment ago: row 3's units always meet row 3's price. The index is also how you pick out particular rows by their labels.
Check yourself
2 questions to try on the lesson page.
So what
shape, columns and dtypes tell you what a table holds before you trust it, and square brackets pull out exactly the columns a question needs.