Choosing the Chart for the Question
The question you're answering picks the chart, a line for change over time, bars to compare groups, a scatter plot for two things that may move together, a histogram for how values are spread, and sorted bars of shares for the parts of a whole, because a pie's slices are hard to compare by eye.
Journeyman · Python · Updated
After this lesson you can
- Choose a line chart, bar chart, scatter plot or histogram from the kind of question being asked
- Show the parts of a whole as a sorted bar chart of shares, and explain why a pie chart is harder to read
Key takeaways
- Start from the question, not the chart. Change over time is a line, comparing groups is bars, a relationship is a scatter plot, and a spread is a histogram.
- A line joins its points in order, so it fits only values that have an order, such as months. Neighborhoods have none, so they get bars.
- The parts of a whole, such as each neighborhood's share of the city's recycling, read best as bars of percentages, sorted largest first.
- A pie chart asks the reader to compare angles, which people judge poorly, so two slices of 15.6% and 14.2% look the same size.
You have the answer in a table, and someone asked a question. Before any chart code, there's a decision: which chart? A class presentation, a report for a manager and a page for a city council all reach this moment, and the wrong choice can hide the answer or suggest something untrue. This lesson is how to choose.
The example for this chapter is Clearwater City's recycling program, pickups.csv: one row for each of the city's six neighborhoods in each month of 2024 and 2025, 144 rows. Its columns are month, neighborhood, tons_recycled, tons_trash, households and households_recycling (how many households set out a recycling cart that month). Curbside recycling pickup began in January 2025. The data is our own made-up data, and Exercise: Fix the Misleading Charts comes with the seed.py that makes it.
Five questions, one habit
Load the log in a notebook cell, with parse_dates so the months are dates:
import matplotlib.pyplot as plt
import pandas as pd

pickups = pd.read_csv("pickups.csv", parse_dates=["month"])
pickups[["month", "neighborhood", "tons_recycled", "households", "households_recycling"]].head(3)
       month neighborhood  tons_recycled  households  households_recycling
0 2024-01-01     Downtown           39.9        5600                  2525
1 2024-01-01     Lakeview           30.2        3500                  1955
2 2024-01-01   Maple Park           23.2        2800                  1463
VS Code draws the table as a grid; this lesson shows it as pandas prints it as text. A council member sends five questions:
- Did recycling go up after curbside pickup began?
- Which neighborhood recycled the most in 2025?
- Do neighborhoods with more households recycle more?
- How much does a neighborhood usually recycle in a month?
- What share of the city's recycling does each neighborhood make?
A common habit is to reach for the same chart every time, or a pie because it looks friendly. That habit breaks fast. A line drawn through the six neighborhoods suggests that recycling changes from Downtown to Lakeview, as if one came after the other. A pie of the shares leaves the reader squinting at two slices that look the same. The chart has to come from the question.
The question picks the chart
Each question has a shape, and each shape has a chart:
| The question asks about | The chart | Clearwater's question |
|---|---|---|
| Change over time | A line chart: one point per month, joined in order | 1. Did recycling go up? |
| Comparing groups | A bar chart: one bar per group, its length the value | 2. Which neighborhood recycled the most? |
| Whether two things move together | A scatter plot: one dot per row, one number across, one up | 3. More households, more recycling? |
| How the values are spread | A histogram: how many values fall in each range | 4. What's a usual month? |
| The parts of a whole | Bars of shares, sorted largest first | 5. Each neighborhood's share |
The reason is in how each chart is read. A line joins its points in order, so the eye reads a slope: up, down, flat. That only means something when the values have an order, such as months. Bars are read by their length, which works for any set of groups. A scatter plot needs two numbers for each row, and a histogram one column with many values. Each chart's table comes from the pandas you know, such as groupby("month") for question 1, and Line Charts: Change Over Time, Bar Charts: Comparing Categories, Scatter Plots: Do Two Things Move Together? and Histograms: How Values Are Spread show how to draw each one.
Parts of a whole: bars beat pies
Question 5 asks for shares: each neighborhood's part of the city's 2025 recycling, as a percentage. Total each neighborhood, sorted largest first, then divide by the grand total:
year_2025 = pickups[pickups["month"].dt.year == 2025]
by_neighborhood = year_2025.groupby("neighborhood")["tons_recycled"].sum().sort_values(ascending=False)
shares = (by_neighborhood / by_neighborhood.sum() * 100).round(1)
shares
neighborhood
Downtown      21.5
Westgate      19.8
Riverside     17.2
Lakeview      15.6
Oak Hill      14.2
Maple Park    11.7
Name: tons_recycled, dtype: float64
The shares add up to 100%, which makes a pie chart tempting. But a pie asks the reader to compare angles and areas, and people judge those poorly. Lakeview's 15.6% and Oak Hill's 14.2% are slices that look the same size, and Downtown's lead over Westgate disappears. In a bar chart each share is a length measured from the same starting line, so a difference of 1.4 points shows:
fig, ax = plt.subplots()
ax.barh(shares.index, shares.values)
ax.invert_yaxis()
ax.bar_label(ax.containers[0], fmt="%.1f%%")
ax.set_title("Downtown recycled the largest share in 2025")
ax.set_xlabel("Share of the city's recycling (%)")
plt.show()
ax.barh draws the bars across, so the names have room, and ax.invert_yaxis() puts the first row, the largest share, at the top. ax.bar_label writes each value on its bar (fmt="%.1f%%" is one decimal place and a percent sign), and plt.show() shows the finished chart under the cell.
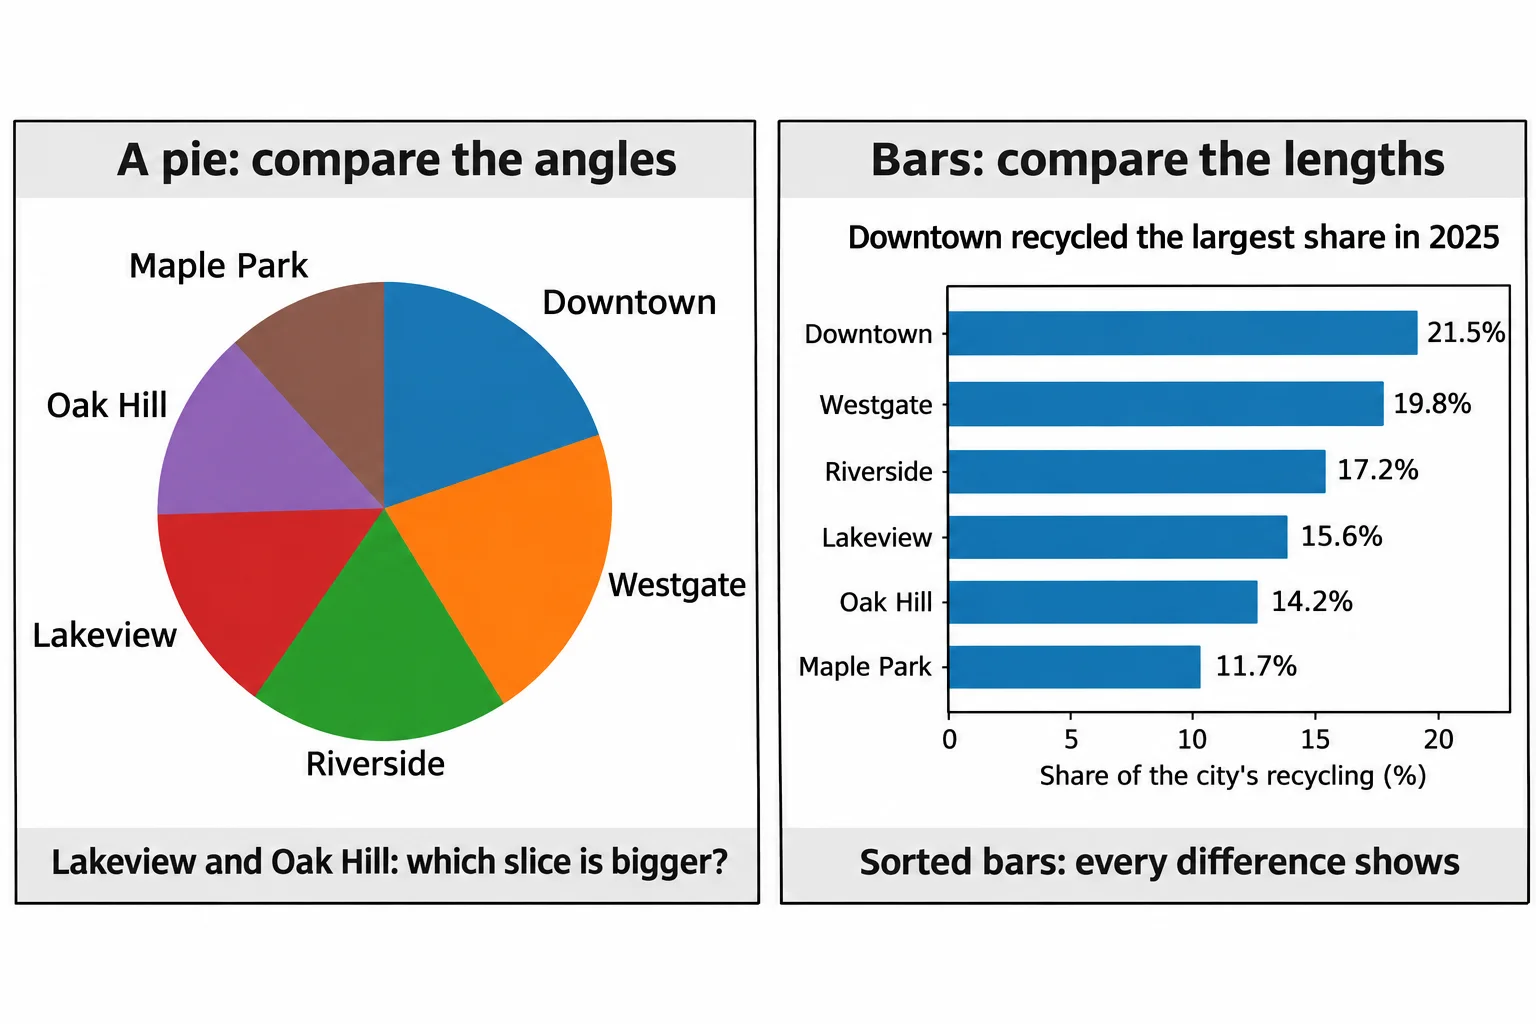
Here's the test for any chart: say the question out loud, then look at the chart and see whether its shape answers it. If you have to read the numbers to find the answer, choose again.
Check yourself
2 questions to try on the lesson page.
So what
The question picks the chart: a line for time, bars for groups and for shares, a scatter plot for two numbers that may move together and a histogram for a spread, and the right one lets a reader see the answer before they read a single number.