Titles, Labels and Units That Explain
A chart explains itself when its title states the finding, each axis label names what it measures and its unit, its tick labels are readable, an arrow from ax.annotate points at the one value that matters, and a legend appears only when there's more than one line to tell apart.
Journeyman · Python · Updated
After this lesson you can
- Write a chart title that states the finding, and axis labels that give what each axis measures and its unit
- Point out one value with ax.annotate, and add a legend only when a chart has more than one series
Key takeaways
- A title that states the finding, such as "Recycling rose 18% after curbside pickup began", tells the reader what to see before they look.
- Every axis label names what it measures and its unit, such as "Recycled (tons)", so nobody has to guess between tons, pounds and trips.
- Tick labels people can read, such as month names instead of 1 to 12, save the reader from decoding the axis.
- ax.annotate writes a note with an arrow pointing at one value, and a legend earns its place only when a chart has more than one line.
A chart often travels without you: pasted into a slide, printed in a newsletter, forwarded to someone who never saw your notebook. Whatever it needs to say has to be on the chart itself. A busy reader looks at a chart for a few seconds, reads the title, glances at the axes, and moves on. This lesson makes those few seconds count.
The example is Clearwater City's recycling log, pickups.csv: one row for each of six neighborhoods in each month of 2024 and 2025, with tons_recycled among its columns. Curbside recycling pickup began in January 2025.
A chart that makes the reader guess
Here's the city's recycling each month, drawn the quick way:
import matplotlib.pyplot as plt
import pandas as pd

pickups = pd.read_csv("pickups.csv", parse_dates=["month"])
monthly = pickups.groupby("month")["tons_recycled"].sum()

fig, ax = plt.subplots()
ax.plot(monthly.index, monthly.values)
ax.set_title("tons_recycled")
plt.show()
The line goes up, but the reader has questions. Tons of what, recycled where? Is up good? Did something happen? The title is a column name, which means something to you and nothing to a council member. The answer is in your head, not on the chart.
A title that states the finding
A title can name the topic ("Monthly recycling") or state the finding ("Recycling rose 18% after curbside pickup began"). The second one tells the reader what to look for, and the chart then shows them it's true. Work the number out from the data, so the title can't drift from it:
by_year = monthly.groupby(monthly.index.year).sum()
rise = (by_year[2025] / by_year[2024] - 1) * 100
print("2024:", round(by_year[2024], 1))
print("2025:", round(by_year[2025], 1))
print(f"rise: {rise:.0f}%")
2024: 2569.8
2025: 3035.5
rise: 18%
{rise:.0f} in the f-string rounds to a whole number with no decimal places. A finding title must be true for the whole chart, so check it against the numbers every time the data changes.
Labels with units, and ticks people can read
An axis label says what the axis measures and in what unit, with the unit in parentheses: Recycled (tons), never tons_recycled. The tick labels are the small labels along each axis, here the dates. With dates, they can crowd and overlap; fig.autofmt_xdate() tilts them so each one is readable. Here's the chart again, with a title, labels and a note:
fig, ax = plt.subplots()
ax.plot(monthly.index, monthly.values, marker="o")
ax.set_title(f"Recycling rose {rise:.0f}% after curbside pickup began")
ax.set_xlabel("Month")
ax.set_ylabel("Recycled (tons)")
ax.annotate("Curbside pickup begins",
            xy=(pd.Timestamp("2025-01-01"), monthly.loc["2025-01-01"]),
            xytext=(pd.Timestamp("2024-03-01"), 280),
            arrowprops={"arrowstyle": "->"})
fig.autofmt_xdate()
plt.show()
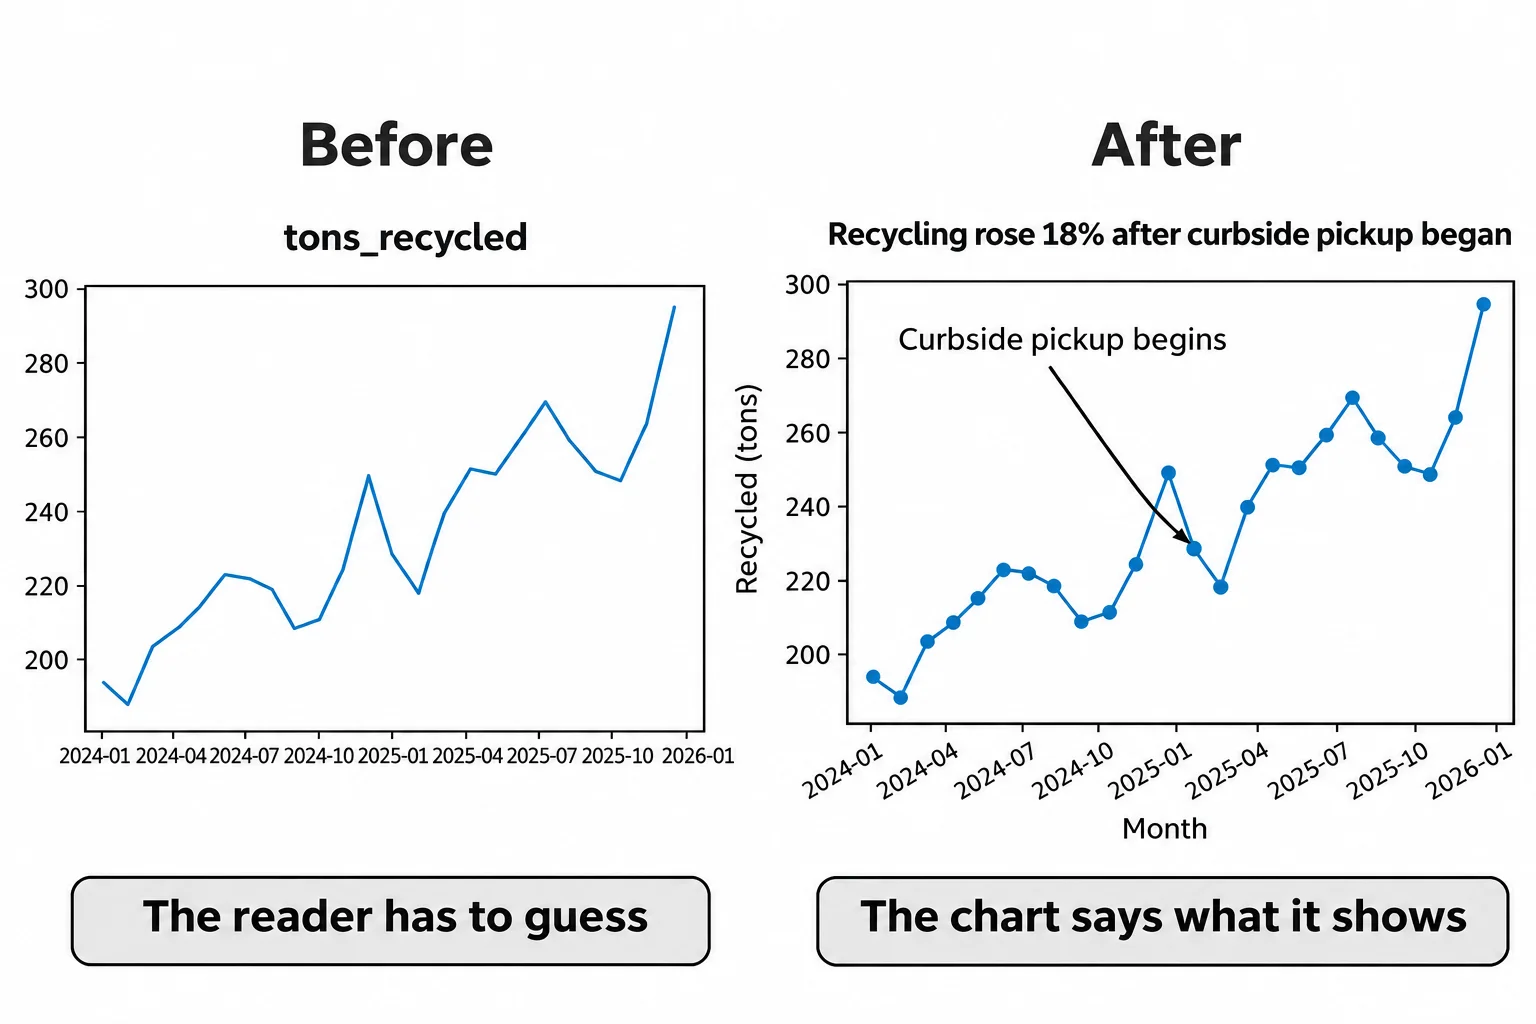
ax.annotate (read "annotate", to add a note) writes text with an arrow to one point. xy= is the point the arrow touches: January 2025 and its tons. xytext= is where the words sit, in the same units as the data, and arrowprops={"arrowstyle": "->"} draws the arrow. Use it for the one point that matters. Five notes on one chart compete, and none gets read.
You can read back what a chart says, the way a test does:
print("title:", ax.get_title())
print("x label:", ax.get_xlabel())
print("y label:", ax.get_ylabel())
print("legend:", ax.get_legend())
title: Recycling rose 18% after curbside pickup began
x label: Month
y label: Recycled (tons)
legend: None
A legend only when there's more than one line
A legend is the key that says which line is which. This chart has one line, and the title already says what it is, so it has no legend: ax.get_legend() gives None, read "none", nothing there. A legend earns its place when there's more than one line. To compare each month of 2025 with the same month of 2024, draw one line per year, give each a label=, and call ax.legend(). Month names make readable tick labels too:
months = ["Jan", "Feb", "Mar", "Apr", "May", "Jun", "Jul", "Aug", "Sep", "Oct", "Nov", "Dec"]

fig, ax = plt.subplots()
ax.plot(months, monthly.loc["2024"].values, marker="o", label="2024")
ax.plot(months, monthly.loc["2025"].values, marker="s", label="2025")
ax.set_title("Every month of 2025 beat the same month of 2024")
ax.set_xlabel("Month")
ax.set_ylabel("Recycled (tons)")
ax.legend(title="Year")
plt.show()
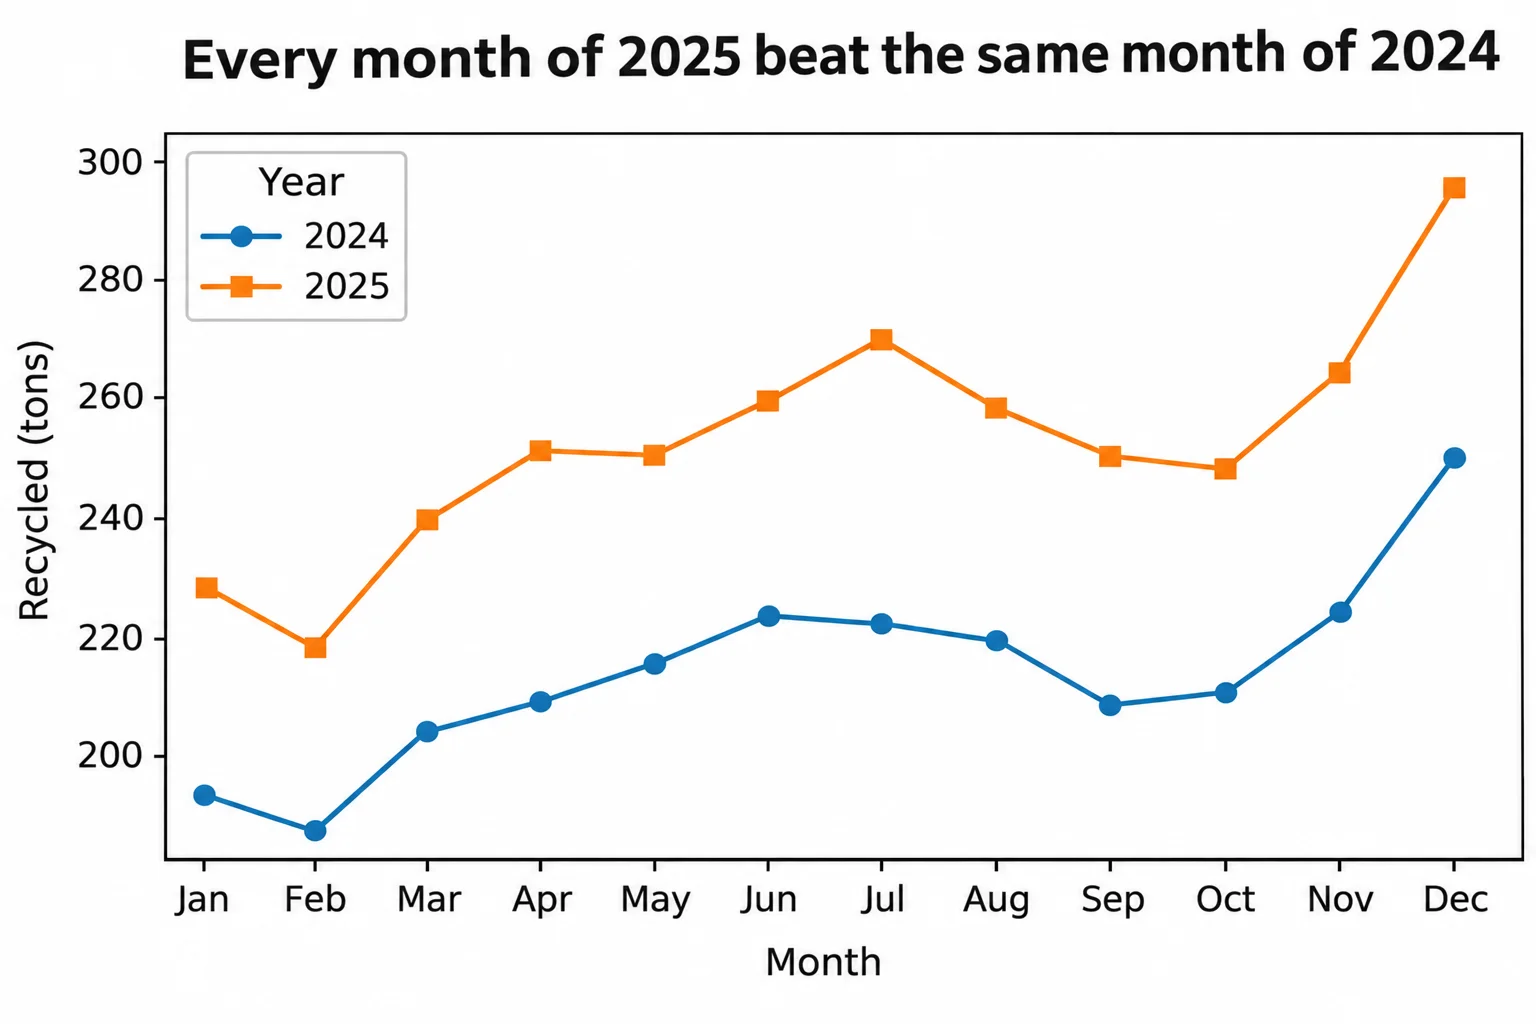
monthly.loc["2024"] picks every month of 2024 from the dates in the index. ax.legend(title="Year") lists each line's label under a heading, so the reader can tell the years apart by their markers as well as their colors.
Check yourself
2 questions to try on the lesson page.
So what
A title that states the finding, labels with units and one well-placed note turn a line someone has to decode into an answer they can read in a few seconds.