Permutation Importance
To see which features any fitted model leans on, shuffle one column of held-out data so its link to the label is broken, score the model again, and take the difference, which scikit-learn's permutation_importance repeats n_repeats times with a random_state, giving a fairer answer than a tree's built-in feature_importances_, though features that move together can each look less important than they are.
Freelancer · AI Basics · Python · Updated
After this lesson you can
- Compute permutation importance by hand by shuffling one column, scoring again and subtracting the error before from the error after
- Run permutation_importance on held-out data with n_repeats and random_state, and read each feature's mean importance and its spread
- Explain why a tree's impurity-based feature_importances_ can mislead, and why features that move together can each look unimportant
Key takeaways
- Permutation importance shuffles one column, scores the model again, and takes the difference. The bigger the drop in the score, the more the model leans on that column.
- Compute it on held-out data. On the training data it also credits the columns a model used to memorize noise.
- n_repeats shuffles each column several times, giving a mean and a spread, and random_state makes the shuffles repeat.
- A tree's built-in feature_importances_ comes from the training data and favors columns with many different values, so it can rank a useless column high.
- When two features move together, shuffling one leaves the other, so both can look less important than they are.
Greenway Home Energy's best model is a random forest (Random Forests): 200 trees, each with dozens of questions. Nobody can read 200 trees, but the manager still asks what the model leans on before the estimates go out. Most models in real use are too big to read, so you'll need a way to ask any model that question from the outside.
The example is Greenway's home_energy.csv, from Exercise: Explain the Energy Bill.
Shuffle one column and watch the error
To find out how much a cook relies on the oven thermometer, swap it for one that shows random numbers. If the food gets much worse, the cook leaned on it; if nothing changes, they didn't. A model can be tested the same way: shuffle one column of the test data, so each home gets another home's value. The values still look normal, but their link to each home's bill is broken. Score the model again: the error after the shuffle minus the error before is how much the model leans on that column. That's permutation importance ("permutation" is a mathematician's word for a reordering).
Here it is by hand, for a small model written as a function and four homes. A real shuffle is random; here each value moves down one row (the last one to the top), so the result is the same every time:
def guess_bill(home):
    return 35 + 0.045 * home["size_sqft"] + 8 * home["occupants"]


homes = [
    {"size_sqft": 1200, "occupants": 1},
    {"size_sqft": 1800, "occupants": 4},
    {"size_sqft": 2400, "occupants": 2},
    {"size_sqft": 3000, "occupants": 3},
]
bills = [101, 146, 163, 191]


def average_miss(homes, bills):
    misses = [abs(bill - guess_bill(home)) for home, bill in zip(homes, bills)]
    return sum(misses) / len(misses)


def shuffled(homes, column):
    values = [home[column] for home in homes]
    moved = values[-1:] + values[:-1]
    new_homes = []
    for home, value in zip(homes, moved):
        copy = dict(home)
        copy[column] = value
        new_homes.append(copy)
    return new_homes


before = average_miss(homes, bills)
print("Average miss:", round(before, 2))
for column in ["size_sqft", "occupants"]:
    after = average_miss(shuffled(homes, column), bills)
    print(column, "shuffled:", round(after, 2), "importance:", round(after - before, 2))
Average miss: 3.25
size_sqft shuffled: 39.25 importance: 36.0
occupants shuffled: 12.75 importance: 9.5
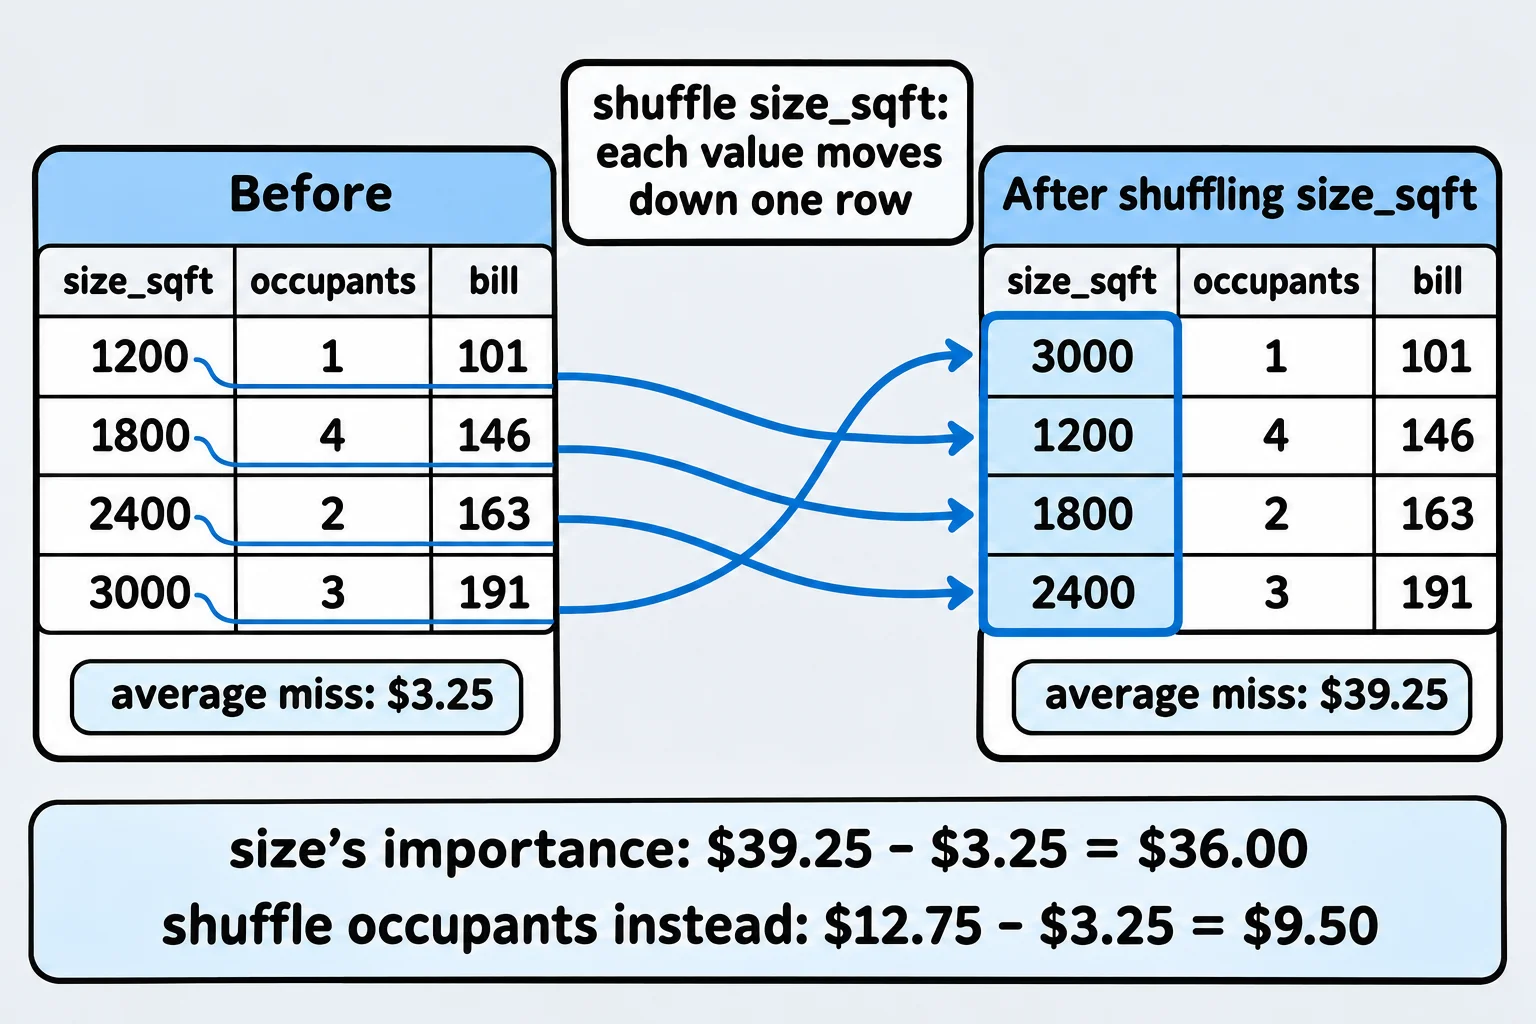
The error is the mean absolute error (Errors and the Mean Absolute Error), so each importance is in dollars: scrambling the sizes adds $36 to the average miss. The function never looked inside the model; it only asked for guesses. That's why this works for any model.
permutation_importance in scikit-learn
scikit-learn's permutation_importance does the same with real random shuffles. Here's the forest, trained on 560 homes and measured on the 140 it never saw:
import pandas as pd
from sklearn.compose import make_column_transformer
from sklearn.ensemble import RandomForestRegressor
from sklearn.inspection import permutation_importance
from sklearn.metrics import mean_absolute_error
from sklearn.model_selection import train_test_split
from sklearn.pipeline import make_pipeline
from sklearn.preprocessing import OneHotEncoder

homes = pd.read_csv("home_energy.csv")
features = ["size_sqft", "year_built", "insulation", "heating", "occupants", "has_pool"]
X_train, X_test, y_train, y_test = train_test_split(
    homes[features], homes["monthly_bill"], test_size=0.2, random_state=42)

prep = make_column_transformer(
    (OneHotEncoder(handle_unknown="ignore"), ["insulation", "heating"]),
    remainder="passthrough",
    verbose_feature_names_out=False,
)
forest = make_pipeline(prep, RandomForestRegressor(n_estimators=200, random_state=0))
forest.fit(X_train, y_train)
print("Test MAE:", round(mean_absolute_error(y_test, forest.predict(X_test)), 2))
Test MAE: 11.27
result = permutation_importance(forest, X_test, y_test, n_repeats=10, random_state=0,
                                scoring="neg_mean_absolute_error")
table = pd.DataFrame({
    "feature": features,
    "importance": result.importances_mean.round(2),
    "spread": result.importances_std.round(2),
}).sort_values("importance", ascending=False)
print(table.to_string(index=False))
   feature  importance  spread
 size_sqft       16.31    1.01
insulation       10.82    1.08
 occupants        4.15    0.54
   heating        2.83    0.40
  has_pool        1.67    0.33
year_built       -0.01    0.18
It's given the fitted model and the test rows. n_repeats=10 shuffles each column ten times, each a different random order: importances_mean is the average and importances_std the spread (a standard deviation). random_state=0 makes those shuffles the same on every run. And scoring="neg_mean_absolute_error" scores with the MAE, made negative because scikit-learn's scores go up when a model is better; without it, a regressor is scored with its own default, R². So each importance is dollars added to the average miss: about $16.31 for size, $10.82 for insulation, and nothing for the year built: its shuffles moved the error by a few cents up or down, by chance, and averaged out to −0.01.
A pool adds $30 to a bill, yet its importance is only $1.67: few homes have a pool, so most shuffles swap a 0 for another 0. Importance says how much the model's error depends on a column across these homes, not how big its effect is on one home.
Why the test rows? On the training rows, the same call gives the year built 3.14: the forest used the year to fit noise in the bills it learned from, which didn't help on new homes. scikit-learn's guide says a feature important on the training data but not on held-out data may be causing overfitting.
The forest's own feature_importances_
Tree models also come with feature_importances_, built in:
built_in = pd.Series(forest[-1].feature_importances_, index=forest[0].get_feature_names_out())
print(built_in.sort_values(ascending=False).round(3))
size_sqft            0.517
insulation_poor      0.185
occupants            0.091
year_built           0.054
heating_electric     0.042
insulation_good      0.039
has_pool             0.037
heating_heat pump    0.016
insulation_fair      0.014
heating_gas          0.006
dtype: float64
These add up to 1 and measure how much each feature's questions cut the error while the trees were trained. Your textbook may call it impurity-based importance, or MDI. The year built, which does nothing, ranks above electric heat and the pool. scikit-learn's docs give two reasons: it's computed from the training data, so it credits what the trees used to fit noise; and it favors features with many different values (75 different years, but a pool is only 0 or 1). Permutation importance on held-out data avoids both.
When features move together
Shuffling insulation leaves the year built, which carries part of what insulation says, so the model loses less than it would. When two features move together, both can look less important than they are. Train the forest without insulation, and the year steps in:
no_insulation = ["size_sqft", "year_built", "heating", "occupants", "has_pool"]
prep2 = make_column_transformer(
    (OneHotEncoder(handle_unknown="ignore"), ["heating"]),
    remainder="passthrough",
    verbose_feature_names_out=False,
)
forest2 = make_pipeline(prep2, RandomForestRegressor(n_estimators=200, random_state=0))
forest2.fit(X_train[no_insulation], y_train)
result2 = permutation_importance(forest2, X_test[no_insulation], y_test, n_repeats=10,
                                 random_state=0, scoring="neg_mean_absolute_error")
print(pd.Series(result2.importances_mean, index=no_insulation).round(2))
size_sqft     13.32
year_built     3.29
heating        2.15
occupants      3.04
has_pool       1.48
dtype: float64
The year built went from nothing to $3.29. Permutation importance tells you how much this model leans on a column, not what causes a bill. scikit-learn's guide suggests grouping features that move together and keeping one from each group.
Do it: measure how much a model leans on one column
Greenway's team has a small model, written as a function, that guesses a home's bill from its size and its pool. You'll measure how much it leans on each column by shuffling it.
The inputs:
homes: a list of homes, each a dictionary with"size_sqft","has_pool"(1 or 0) and"occupants".bills: each home's real bill, in the same order.column: the name of the column to shuffle.order: the shuffle, as a list of row numbers. After the shuffle, homeigets the value homeorder[i]had.
The model, guess_bill(home), is given: $40, plus $0.05 a square foot, plus $30 for a pool. It doesn't look at occupants.
For example, with three homes:
homes = [
    {"size_sqft": 1000, "has_pool": 0, "occupants": 2},
    {"size_sqft": 2000, "has_pool": 1, "occupants": 3},
    {"size_sqft": 3000, "has_pool": 0, "occupants": 4},
]
bills = [95, 175, 185]
The guesses are 90, 170 and 190, so each misses by 5 and average_miss(homes, bills) is 5.0. Shuffling "size_sqft" with the order [2, 0, 1]:
| Home | Size after the shuffle | Guess | Bill | Miss |
|---|---|---|---|---|
| 0 | home 2's: 3,000 | 40 + 150 = 190 | 95 | 95 |
| 1 | home 0's: 1,000 | 40 + 50 + 30 = 120 | 175 | 55 |
| 2 | home 1's: 2,000 | 40 + 100 = 140 | 185 | 45 |
The average miss after is (95 + 55 + 45) / 3 = 65.0, so importance(homes, bills, "size_sqft", [2, 0, 1]) returns 65.0 − 5.0 = 60.0.
Your job: write two functions.
average_miss(homes, bills)returns the average of the misses: for each home, the bill minusguess_bill(home), made positive withabs().importance(homes, bills, column, order)returns the average miss after shufflingcolumnthe wayordersays, minus the average miss before.importanceleaveshomesas it was: shuffle copies of the homes, never the homes themselves.
Practiced live on the lesson page: write the Python right there and check it.
Check yourself
2 questions to try on the lesson page.
So what
Permutation importance asks any model which columns it leans on by breaking one at a time on data it never saw: a fair answer about the model, as long as you remember it isn't an answer about the world.
Sources
- scikit-learn, Permutation feature importance, User Guide: the decrease in a model's score when one feature's values are randomly shuffled, which breaks the feature's relationship with the target; it is model-agnostic and can be repeated with different permutations to measure the variance; it can be computed on the training set or on held-out data, and features important on the training set but not on held-out data might cause the model to overfit; evaluate the model on held-out data first, since it shows how important a feature is for a particular model, not its intrinsic predictive value. Relation to impurity-based importance in trees: impurity-based importance can rank features that aren't predictive on unseen data highly when a model overfits, and favors high cardinality features (many unique values) over low cardinality ones such as binary features. Misleading values on strongly correlated features: when one of two correlated features is permuted, the model still has access to it through the other, so both get a lower importance though they might be important; one remedy is to cluster correlated features and keep one from each cluster.
- scikit-learn 1.9.1, permutation_importance, API reference:
n_repeats(default 5) is the number of times each feature is permuted;random_statecontrols the permutations, and an int gives the same results every run; withscoring=Nonethe estimator's default score is used; the result holdsimportances_mean,importances_stdand the rawimportances. - scikit-learn example, Permutation Importance vs Random Forest Feature Importance (MDI): impurity-based importances are biased toward high cardinality features and are computed on training set statistics, so a random, useless column can rank high; permutation importance on a held-out test set ranks the random columns near zero, and on the training set ranks them higher, a sign the forest used them to overfit.
- scikit-learn 1.9.1, RandomForestRegressor, API reference:
feature_importances_holds the impurity-based importances, which sum to 1, with the warning that they can be misleading for high cardinality features and thatpermutation_importanceis an alternative; itsscoremethod returns the coefficient of determination, R². - scikit-learn, Metrics and scoring: string name scorers, User Guide: all scorer objects follow the convention that higher return values are better, so metrics that measure the distance between the model and the data are available negated, as
neg_mean_absolute_erroris formean_absolute_error.