The Middle and the Spread
A column of numbers is summed up by its middle, the mean (the average) or the median (the middle value, which one extreme value can't drag), and by its spread, the standard deviation (how far values typically sit from the mean), the percentiles and the range, which statistics and describe() work out and a histogram shows.
Apprentice · AI Basics · Python · Updated
After this lesson you can
- Find a column's mean and median, and explain why one extreme value moves the mean much more than the median
- Read a column's standard deviation, percentiles and range as how spread out its values are, with statistics.stdev and describe()
Key takeaways
- The mean adds every value and divides by how many there are. The median is the middle value once they're sorted.
- One extreme value, such as a $9,000 penthouse, pulls the mean toward it but barely moves the median.
- The standard deviation is how far the values typically sit from the mean. Two columns with the same mean can have very different spreads.
- describe() shows the count, mean, standard deviation, minimum, the 25th, 50th and 75th percentiles and the maximum. The 50th percentile is the median.
- A histogram shows a column's shape, such as one hump in the middle, or a long tail on one side that pulls the mean away from the median.
Someone asks you what apartments rent for in Riverside. "It depends" is true and no help; reading out 300 rents is worse. Two numbers answer it well: where the middle is, and how far the rents spread out around it. You'll work these out for every column before you build a model, and they come back all through the course: the simplest guess is the average, and the error measures of Module 2 and the scaling of Module 4 are built from the same pieces.
The example is Riverside Apartments' listings.csv, from Exercise: Know Your Listings. The code blocks are notebook cells, run in order.
A typical rent: the mean and the median
The mean is the everyday average: add every value up and divide by how many there are. The median is the middle value once the values are sorted from smallest to largest; with an even number of values, it's the average of the two in the middle. Python's statistics module has both:
import csv
import statistics

with open("listings.csv", newline="") as file:
    listings = list(csv.DictReader(file))

rents = [int(listing["monthly_rent"]) for listing in listings]
print("Listings:", len(rents))
print("Mean:", round(statistics.fmean(rents), 2))
print("Median:", statistics.median(rents))
Listings: 300
Mean: 1373.97
Median: 1345.0
fmean is the mean as a float (a number with a decimal point). Here the two middles are close. Now suppose one penthouse joins the listings at $9,000 a month:
with_penthouse = rents + [9000]
print("Mean:", round(statistics.fmean(with_penthouse), 2))
print("Median:", statistics.median(with_penthouse))
Mean: 1399.3
Median: 1350
One apartment out of 301 lifted the mean by about $25, because its $9,000 is added into the total. The median moved $5: it only cares which value is in the middle, not how far the top one is. When a column has a few extreme values, the median is the better "typical"; the mean still matters when you need the total, since the mean times the count is the sum.
How spread out: the standard deviation
Two buildings can have the same middle and be nothing alike:
building_a = [1300, 1350, 1400, 1450, 1500]
building_b = [900, 1100, 1400, 1700, 1900]
for name, rents_here in [("A", building_a), ("B", building_b)]:
    print("Building", name, "mean:", statistics.fmean(rents_here), "standard deviation:", round(statistics.stdev(rents_here), 2))
Building A mean: 1400.0 standard deviation: 79.06
Building B mean: 1400.0 standard deviation: 412.31
The standard deviation is how far the values typically sit from the mean, in the column's own units: building A's rents are typically about $79 from $1,400, building B's about $412. Here are its steps for building A:
| Rent | Distance from the mean, 1,400 | Distance squared |
|---|---|---|
| 1,300 | −100 | 10,000 |
| 1,350 | −50 | 2,500 |
| 1,400 | 0 | 0 |
| 1,450 | 50 | 2,500 |
| 1,500 | 100 | 10,000 |
| Total | 25,000 |
Squaring stops the distances below the mean from canceling the ones above it. Divide the total by one less than the count, 25,000 ÷ 4 = 6,250, then take the square root to get back to dollars: 79.06. Your textbook calls this the sample standard deviation, and the step before the square root the variance. (statistics.pstdev divides by the count instead, for when you have every value there will ever be; stdev's n − 1, read "n minus one", is the usual choice for data that's a sample.) For all 300 listings, statistics.stdev gives 356.87.
The whole column at once: describe()
pandas' describe() puts the middle and the spread on one screen:
import pandas as pd

table = pd.read_csv("listings.csv")
table["monthly_rent"].describe()
count     300.000000
mean     1373.966667
std       356.869891
min       465.000000
25%      1143.750000
50%      1345.000000
75%      1611.250000
max      2295.000000
Name: monthly_rent, dtype: float64
std is the same standard deviation as statistics.stdev. The rows marked with % are percentiles: about a quarter of the rents are below the 25th percentile, $1,143.75, and about three quarters below the 75th, $1,611.25, so the middle half of the apartments rent for between those two. The 50th percentile is the median. The range is the maximum minus the minimum: $2,295 − $465 = $1,830.
A histogram's shape in words
A histogram sorts the values into bins of equal width and draws a bar for how many fall in each:
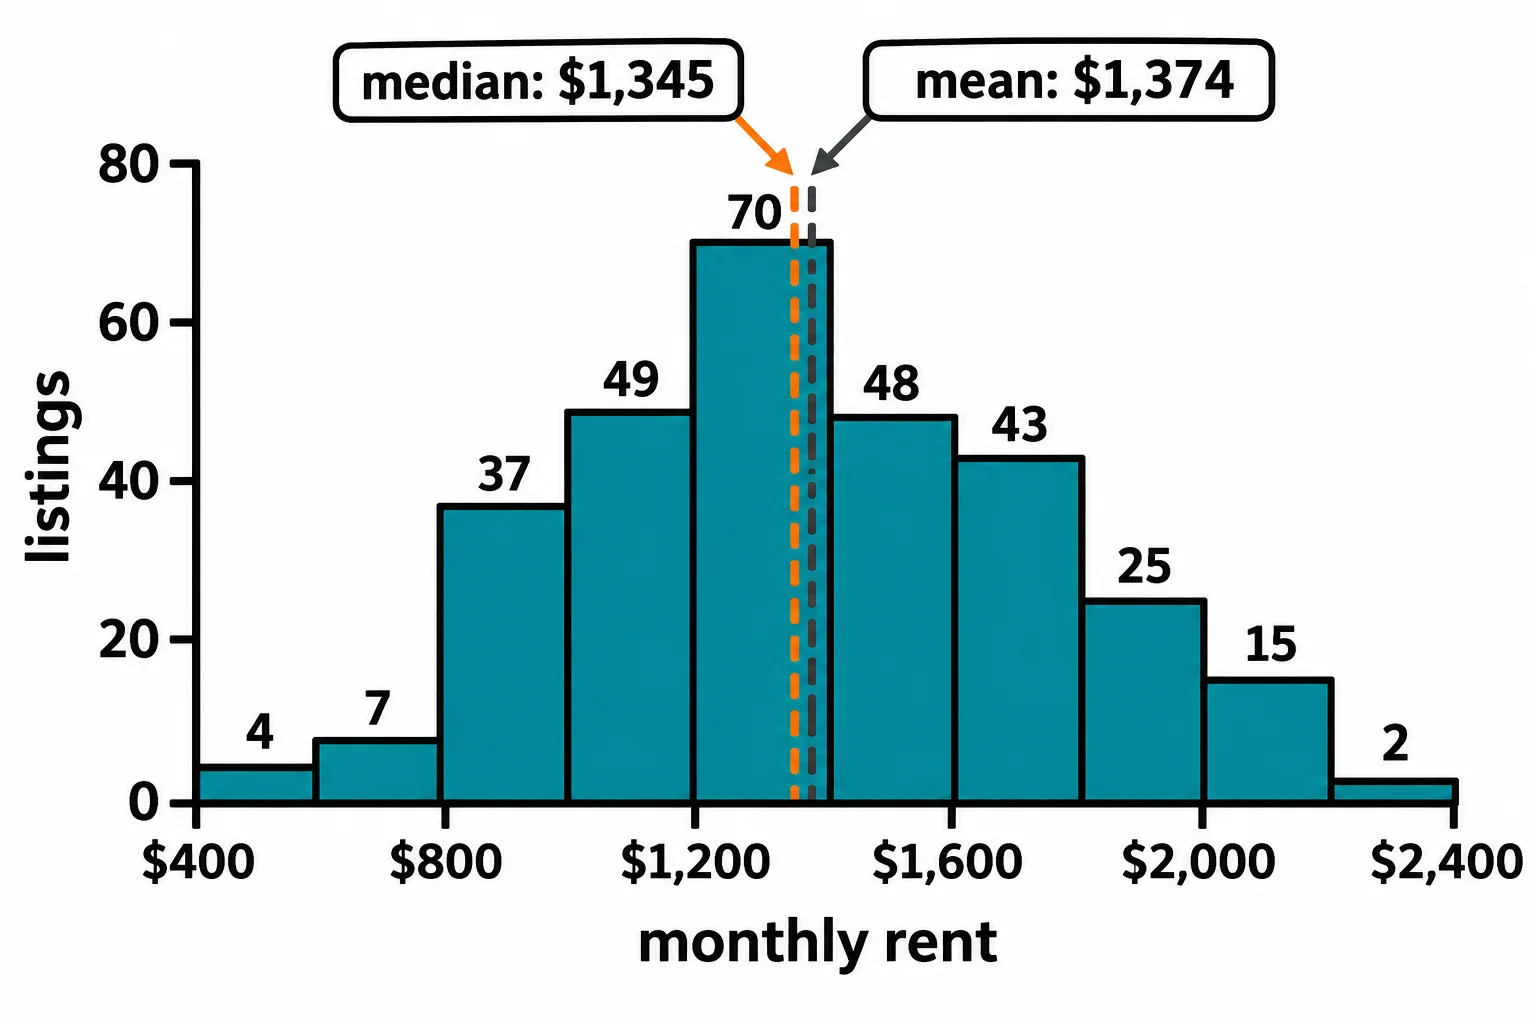
Say a shape in words: one hump, where its peak is, and whether one side trails off further. Riverside's rents have one hump at $1,200 to $1,400 and two sides that fall away at about the same pace, which is why the mean and the median are close. A column with a long tail on one side, such as home prices with a few mansions, is skewed: its mean is pulled toward the tail, away from its median.
Do it: the middle and the spread of a building's rents
A Riverside owner hands you one building's rents and wants their middle and spread, worked out by hand.
The input:
rents: a list of monthly rents, in no particular order, always at least two of them.
For example, [1100, 900, 1900, 1000, 1100]:
| Step | Working | Result |
|---|---|---|
| Mean | (1100 + 900 + 1900 + 1000 + 1100) ÷ 5 | 1200.0 |
| Median | sorted: 900, 1000, 1100, 1100, 1900 | 1100 |
| Distances squared | 100², 300², 700², 200², 100² = 10,000 + 90,000 + 490,000 + 40,000 + 10,000 | 640,000 |
| Standard deviation | the square root of 640,000 ÷ (5 − 1) = 160,000 | 400.0 |
So middle_and_spread([1100, 900, 1900, 1000, 1100]) returns {"mean": 1200.0, "median": 1100, "std": 400.0}.
Your job: write middle_and_spread(rents), working each number out with a loop and arithmetic rather than the statistics module.
- It returns a dictionary with the keys
"mean","median"and"std". "mean"is the total divided by the count."median"is the middle rent once sorted, or the average of the two middle rents when the count is even."std"is the square root of the squared distances' total divided by the count minus one.** 0.5takes a square root.- Each value is rounded to 2 decimal places with
round(). - It doesn't change the order of the list it was given.
Practiced live on the lesson page: write the Python right there and check it.
Check yourself
2 questions to try on the lesson page.
So what
Before you trust a column, know its middle and its spread: the mean or the median for a typical value, the standard deviation and the percentiles for how far values stray, and a histogram for the shape that tells you which middle to believe.
Sources
- Python documentation, statistics:
fmeanconverts the data to floats and returns their arithmetic mean;medianreturns the middle value, the average of the two middle values when the count is even;stdevis the sample standard deviation, the square root of the sample variance with N − 1 degrees of freedom (Bessel's correction), and needs at least two values;pstdevis the population standard deviation. - pandas 3.1.1, DataFrame.describe, API reference: for numeric columns,
count,mean,std,min,maxand the 25th, 50th and 75th percentiles by default; the 50th percentile is the same as the median. - pandas 3.1.1, DataFrame.std, API reference: normalized by N − 1 by default (
ddof=1). - pandas 3.1.1, Series.quantile, API reference: percentiles between two values are found by linear interpolation by default, which is why a percentile such as 1,143.75 needn't be a rent in the data.